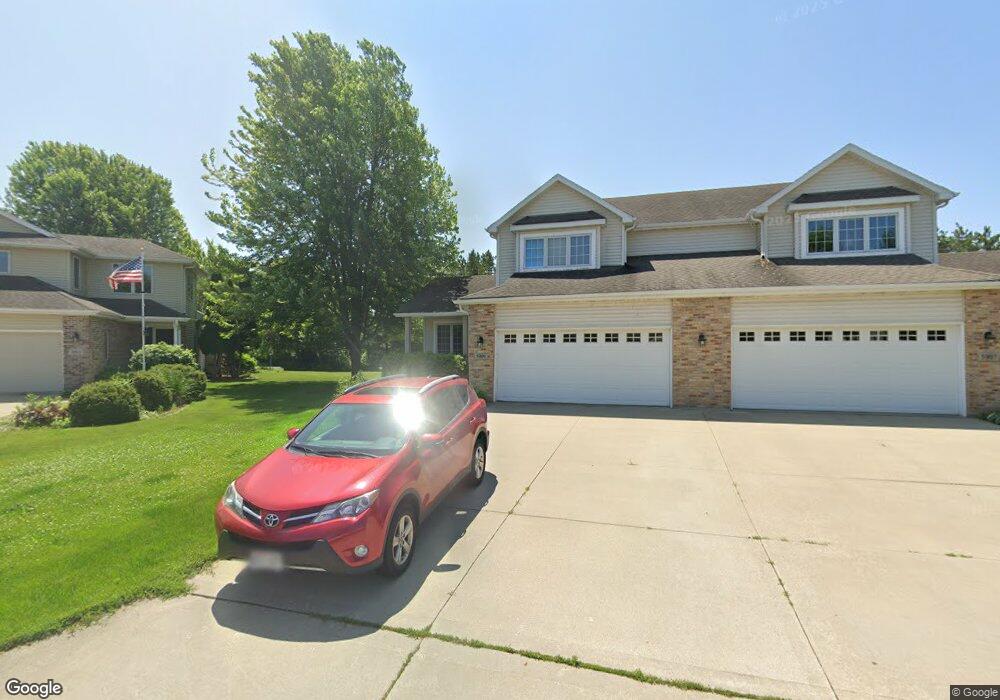
5909 E Open Meadow Mc Farland, WI 53558
Estimated Value: $390,000 - $449,000
3
Beds
3
Baths
1,460
Sq Ft
$282/Sq Ft
Est. Value
About This Home
This home is located at 5909 E Open Meadow, Mc Farland, WI 53558 and is currently estimated at $411,919, approximately $282 per square foot. 5909 E Open Meadow is a home located in Dane County with nearby schools including 4K McFarland, Conrad Elvehjem Primary School, and Waubesa Intermediate School.
Ownership History
Date
Name
Owned For
Owner Type
Purchase Details
Closed on
Jun 12, 2018
Sold by
Wagner John R and Wagner Thomas L
Bought by
Mckenzie Sarah K
Current Estimated Value
Home Financials for this Owner
Home Financials are based on the most recent Mortgage that was taken out on this home.
Original Mortgage
$223,250
Outstanding Balance
$191,067
Interest Rate
4.6%
Mortgage Type
New Conventional
Estimated Equity
$220,852
Purchase Details
Closed on
Aug 14, 2015
Sold by
Morris Kelli R
Bought by
Wagner John R and Wagner Thomas L
Home Financials for this Owner
Home Financials are based on the most recent Mortgage that was taken out on this home.
Original Mortgage
$173,700
Interest Rate
4.08%
Mortgage Type
New Conventional
Purchase Details
Closed on
Mar 22, 2013
Sold by
Leander Gary C and Leander Lorraine B
Bought by
Morris Kelli R
Home Financials for this Owner
Home Financials are based on the most recent Mortgage that was taken out on this home.
Original Mortgage
$146,000
Interest Rate
3.5%
Mortgage Type
New Conventional
Create a Home Valuation Report for This Property
The Home Valuation Report is an in-depth analysis detailing your home's value as well as a comparison with similar homes in the area
Home Values in the Area
Average Home Value in this Area
Purchase History
| Date | Buyer | Sale Price | Title Company |
|---|---|---|---|
| Mckenzie Sarah K | $240,000 | None Available | |
| Wagner John R | $193,000 | Attorney | |
| Morris Kelli R | $163,000 | Knight Barry Title Svcs Llc |
Source: Public Records
Mortgage History
| Date | Status | Borrower | Loan Amount |
|---|---|---|---|
| Open | Mckenzie Sarah K | $223,250 | |
| Previous Owner | Wagner John R | $173,700 | |
| Previous Owner | Morris Kelli R | $146,000 |
Source: Public Records
Tax History
| Year | Tax Paid | Tax Assessment Tax Assessment Total Assessment is a certain percentage of the fair market value that is determined by local assessors to be the total taxable value of land and additions on the property. | Land | Improvement |
|---|---|---|---|---|
| 2025 | $6,474 | $403,400 | $54,500 | $348,900 |
| 2023 | $5,826 | $369,900 | $41,900 | $328,000 |
| 2022 | $5,083 | $302,000 | $41,900 | $260,100 |
| 2021 | $4,897 | $268,900 | $41,900 | $227,000 |
| 2020 | $4,837 | $255,100 | $41,900 | $213,200 |
| 2019 | $4,656 | $240,000 | $41,900 | $198,100 |
| 2018 | $4,202 | $211,200 | $41,900 | $169,300 |
| 2017 | $4,229 | $204,500 | $41,900 | $162,600 |
| 2016 | $4,183 | $193,000 | $41,900 | $151,100 |
| 2015 | $3,540 | $166,600 | $41,900 | $124,700 |
| 2014 | $3,632 | $163,000 | $41,900 | $121,100 |
| 2013 | $4,223 | $194,700 | $52,000 | $142,700 |
Source: Public Records
Map
Nearby Homes
- 5703 W Open Meadow
- 6408 Fox Run
- 5942 Rosewood Dr
- 5915 Running Deer Trail
- 5936 Rosewood Dr
- 5937 Rosewood Dr
- 5854 Holscher Rd Unit 5854
- 6567 Prairie Wood Dr
- 6401 Prairie Wood Dr
- 6407 Prairie Wood Dr
- 5406 Lani Ln
- 6419 Prairie Wood Dr
- 6513 Prairie Wood Dr
- 6501 Prairie Wood Dr
- 5802 Sauk Ln
- 5602 Glenway St
- 6115 White Daisy Ct
- 5807 Wisconsin St
- 5005 Highland Dr
- 5371 Little Bluestem Dr
- 5909 E Open Meadow
- 5907 E Open Meadow
- 5907 E Open Meadow
- 5913 E Open Meadow
- 5911 E Open Meadow
- 5911 E Open Meadow
- 5905 E Open Meadow
- 5903 E Open Meadow
- 5903 E Open Meadow
- 5920 E Open Meadow
- 5811 E Open Meadow
- 5811 E Open Meadow
- 5918 E Open Meadow
- 5906 E Open Meadow
- 5809 E Open Meadow
- 5912 E Open Meadow
- 5912 E Open Meadow
- 5809 E Open Meadow
- 5904 E Open Meadow
- 5908 E Open Meadow
Your Personal Tour Guide
Ask me questions while you tour the home.