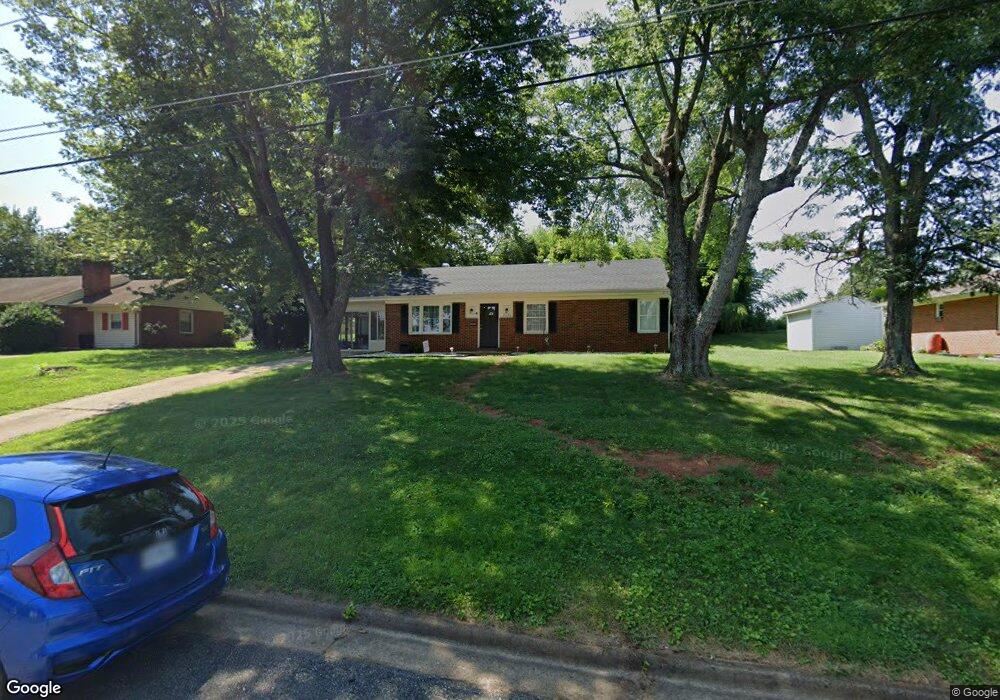
5909 Hines Cir Lynchburg, VA 24502
Sandusky NeighborhoodEstimated Value: $233,000 - $278,000
3
Beds
1
Bath
1,966
Sq Ft
$132/Sq Ft
Est. Value
About This Home
This home is located at 5909 Hines Cir, Lynchburg, VA 24502 and is currently estimated at $259,320, approximately $131 per square foot. 5909 Hines Cir is a home located in Lynchburg City with nearby schools including Sandusky Elementary School, Sandusky Middle School, and Heritage High School.
Ownership History
Date
Name
Owned For
Owner Type
Purchase Details
Closed on
Jun 29, 2021
Sold by
Foster Builder Inc
Bought by
Dishman Joseph H and Wilson Nicolette
Current Estimated Value
Home Financials for this Owner
Home Financials are based on the most recent Mortgage that was taken out on this home.
Original Mortgage
$196,377
Outstanding Balance
$177,795
Interest Rate
2.9%
Mortgage Type
FHA
Estimated Equity
$81,525
Purchase Details
Closed on
Jan 5, 2021
Sold by
Commaboyz Llc
Bought by
Foster Builder Inc
Purchase Details
Closed on
Nov 6, 2020
Sold by
Freyre David F
Bought by
Commaboyz Llc
Purchase Details
Closed on
Jun 10, 2010
Sold by
Simpson Judy T
Bought by
Freyre David F
Home Financials for this Owner
Home Financials are based on the most recent Mortgage that was taken out on this home.
Original Mortgage
$6,225
Interest Rate
4.78%
Mortgage Type
Stand Alone Second
Create a Home Valuation Report for This Property
The Home Valuation Report is an in-depth analysis detailing your home's value as well as a comparison with similar homes in the area
Home Values in the Area
Average Home Value in this Area
Purchase History
| Date | Buyer | Sale Price | Title Company |
|---|---|---|---|
| Dishman Joseph H | $200,000 | Accupoint Title | |
| Foster Builder Inc | $135,000 | None Available | |
| Commaboyz Llc | $115,000 | Chicago National Title | |
| Freyre David F | $124,500 | None Available |
Source: Public Records
Mortgage History
| Date | Status | Borrower | Loan Amount |
|---|---|---|---|
| Open | Dishman Joseph H | $196,377 | |
| Previous Owner | Freyre David F | $6,225 | |
| Previous Owner | Freyre David F | $122,845 |
Source: Public Records
Tax History Compared to Growth
Tax History
| Year | Tax Paid | Tax Assessment Tax Assessment Total Assessment is a certain percentage of the fair market value that is determined by local assessors to be the total taxable value of land and additions on the property. | Land | Improvement |
|---|---|---|---|---|
| 2025 | $1,945 | $231,600 | $40,000 | $191,600 |
| 2024 | $1,670 | $187,600 | $37,500 | $150,100 |
| 2023 | $1,670 | $187,600 | $37,500 | $150,100 |
| 2022 | $1,540 | $149,500 | $35,000 | $114,500 |
| 2021 | $1,659 | $149,500 | $35,000 | $114,500 |
| 2020 | $1,492 | $134,400 | $32,500 | $101,900 |
| 2019 | $1,492 | $134,400 | $32,500 | $101,900 |
| 2018 | $1,420 | $127,900 | $27,000 | $100,900 |
| 2017 | $1,420 | $127,900 | $27,000 | $100,900 |
| 2016 | $1,420 | $127,900 | $27,000 | $100,900 |
| 2015 | $1,420 | $127,900 | $27,000 | $100,900 |
| 2014 | $1,420 | $132,900 | $27,000 | $105,900 |
Source: Public Records
Map
Nearby Homes
- 1501 Lynndale Place
- 916 Sanhill Dr
- 1117 Long Meadows Dr
- 625 Sherman Dr
- 6401 Pawnee Dr
- 618 Hayes Dr
- 4815 Myrtle St
- 4637 Fairmont Ave
- 6276 Pawnee Dr
- 5840 Quaker Pkwy
- 4812 Windsor Ave
- 4610 Alabama Ave
- 4720 Oakdale Dr
- 4532 Fairmont Ave
- 5904 Rhonda Rd
- 913 Johnson Rd
- 1125 Sheffield Dr
- 4632 Golf Park Dr
- 235 Jordan Ct
- 1308 Mckinney Ave
- 5913 Hines Cir
- 5905 Hines Cir
- 5908 Hines Cir
- 5917 Hines Cir
- 900 Sandusky Dr
- 5912 Hines Cir
- 5965 Hines Cir
- 5916 Hines Cir
- 915 Catalina Place
- 5921 Hines Cir
- 808 Sandusky Dr
- 5920 Hines Cir
- 5961 Hines Cir
- 754 Sandusky Dr
- 5957 Hines Cir
- 804 Sandusky Dr
- 756 Sandusky Dr
- 5953 Hines Cir
- 913 Sandusky Dr
- 5924 Hines Cir