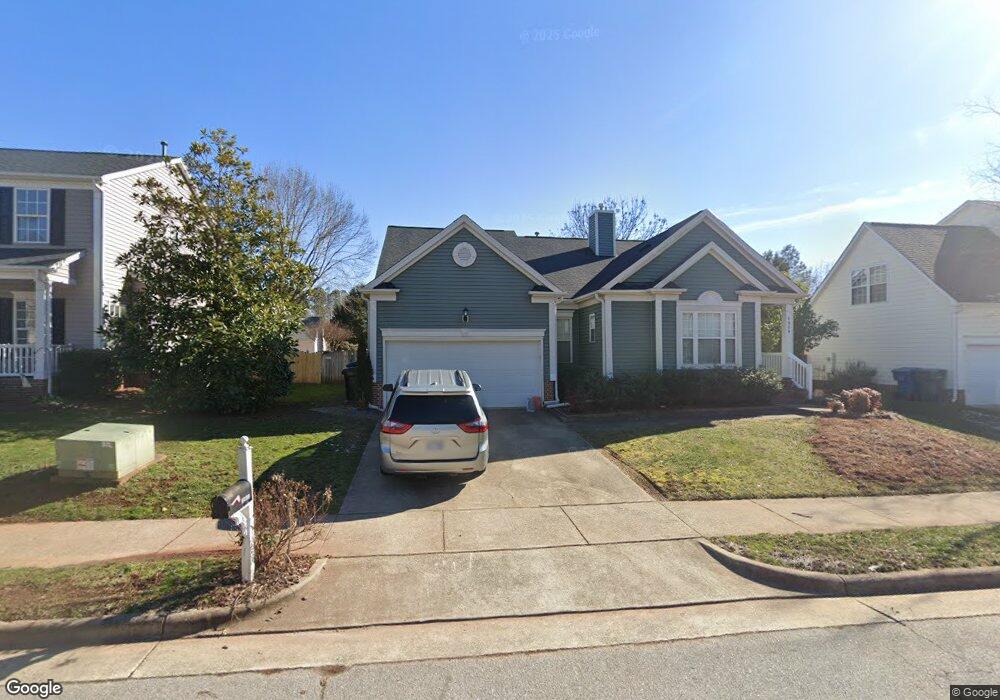
5909 Solitude Way Durham, NC 27713
South Durham NeighborhoodEstimated Value: $463,073 - $508,000
3
Beds
2
Baths
1,965
Sq Ft
$248/Sq Ft
Est. Value
About This Home
This home is located at 5909 Solitude Way, Durham, NC 27713 and is currently estimated at $488,268, approximately $248 per square foot. 5909 Solitude Way is a home located in Durham County with nearby schools including Parkwood Elementary, Lowe's Grove Middle, and Hillside High School.
Ownership History
Date
Name
Owned For
Owner Type
Purchase Details
Closed on
Apr 26, 2016
Sold by
Polum Michael D
Bought by
Merke Megan and Merke Daniel
Current Estimated Value
Home Financials for this Owner
Home Financials are based on the most recent Mortgage that was taken out on this home.
Original Mortgage
$222,000
Outstanding Balance
$177,015
Interest Rate
3.71%
Estimated Equity
$311,253
Purchase Details
Closed on
Apr 3, 2009
Sold by
Polum Michael D and Reeves Joann F
Bought by
Polum Michael D and Reeves Joann F
Home Financials for this Owner
Home Financials are based on the most recent Mortgage that was taken out on this home.
Original Mortgage
$169,500
Interest Rate
5.14%
Purchase Details
Closed on
Jun 9, 2003
Sold by
Patini Joseph and Patini Dawn
Bought by
Polum Michael D
Home Financials for this Owner
Home Financials are based on the most recent Mortgage that was taken out on this home.
Original Mortgage
$70,000
Interest Rate
5.79%
Purchase Details
Closed on
Jan 29, 1999
Sold by
Beazer Homes Corp
Bought by
Patini Joseph and Patini Dawn
Create a Home Valuation Report for This Property
The Home Valuation Report is an in-depth analysis detailing your home's value as well as a comparison with similar homes in the area
Home Values in the Area
Average Home Value in this Area
Purchase History
| Date | Buyer | Sale Price | Title Company |
|---|---|---|---|
| Merke Megan | $242,000 | -- | |
| Polum Michael D | -- | None Available | |
| Polum Michael D | $187,000 | -- | |
| Patini Joseph | $154,000 | -- |
Source: Public Records
Mortgage History
| Date | Status | Borrower | Loan Amount |
|---|---|---|---|
| Open | Merke Megan | $222,000 | |
| Previous Owner | Polum Michael D | $169,500 | |
| Previous Owner | Polum Michael D | $70,000 |
Source: Public Records
Tax History
| Year | Tax Paid | Tax Assessment Tax Assessment Total Assessment is a certain percentage of the fair market value that is determined by local assessors to be the total taxable value of land and additions on the property. | Land | Improvement |
|---|---|---|---|---|
| 2025 | $4,370 | $440,875 | $119,000 | $321,875 |
| 2024 | $3,717 | $266,500 | $59,500 | $207,000 |
| 2023 | $3,491 | $266,250 | $59,250 | $207,000 |
| 2022 | $3,405 | $266,064 | $59,250 | $206,814 |
| 2021 | $3,389 | $266,064 | $59,250 | $206,814 |
| 2020 | $3,310 | $266,064 | $59,250 | $206,814 |
| 2019 | $3,310 | $266,064 | $59,250 | $206,814 |
| 2018 | $2,906 | $214,222 | $35,550 | $178,672 |
| 2017 | $2,885 | $214,222 | $35,550 | $178,672 |
| 2016 | $2,787 | $214,222 | $35,550 | $178,672 |
| 2015 | $3,042 | $219,749 | $37,549 | $182,200 |
| 2014 | $3,042 | $219,749 | $37,549 | $182,200 |
Source: Public Records
Map
Nearby Homes
- 5907 Rustic Wood Ln
- 104 Deblyn Ct
- 1510 Haventree Rd
- 5504 Pelham Rd
- 6353 Grandale Dr
- 1446 Clermont Rd
- 1621 Clermont Rd
- 1209 Citadel Ave
- 704 Colby Place
- 1509 Clermont Rd Unit T27
- 1509 Clermont Rd Unit T24
- 7 Scenic Ct
- 4 Green Springs Ct
- 111 Wenonah Way
- 109 Settlers Mill Ln
- 43 Redbud Ct
- 7 Travis Cir
- 1010 Sturbridge Dr
- 7 Monteith Ct
- 1526 Euclid Rd
- 5911 Solitude Way
- 5907 Solitude Way
- 5913 Solitude Way
- 5908 Rustic Wood Ln
- 5905 Solitude Way
- 5906 Rustic Wood Ln
- 5910 Rustic Wood Ln
- 5910 Solitude Way
- 5912 Solitude Way
- 5903 Solitude Way
- 5908 Solitude Way
- 5904 Rustic Wood Ln
- 3 Monarch Way
- 5914 Solitude Way
- 1 Monarch Way
- 5906 Solitude Way
- 5914 Rustic Wood Ln
- 5916 Solitude Way
- 5901 Solitude Way
- 5 Monarch Way
Your Personal Tour Guide
Ask me questions while you tour the home.