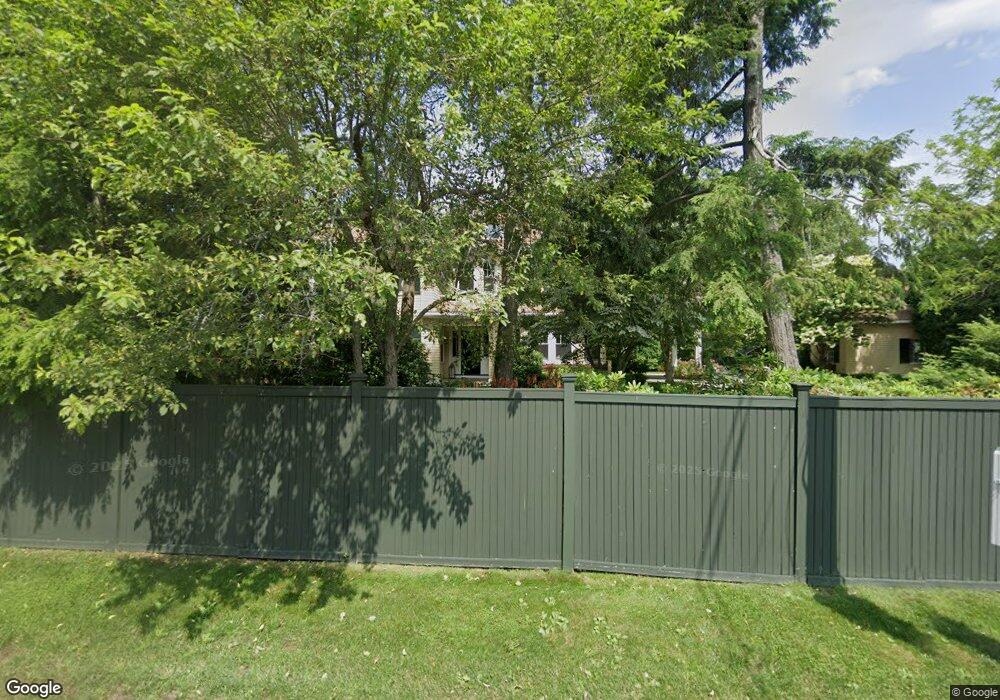
591 Bridge St Dedham, MA 02026
Dexter NeighborhoodEstimated Value: $3,579,000 - $4,354,763
7
Beds
9
Baths
7,678
Sq Ft
$517/Sq Ft
Est. Value
About This Home
This home is located at 591 Bridge St, Dedham, MA 02026 and is currently estimated at $3,966,882, approximately $516 per square foot. 591 Bridge St is a home located in Norfolk County with nearby schools including Riverdale Elementary School, Dedham Middle School, and Dedham High School.
Ownership History
Date
Name
Owned For
Owner Type
Purchase Details
Closed on
Aug 1, 1991
Sold by
Lynch David B and Lynch Josephine D
Bought by
Atwood James A and Atwood Kristen K
Current Estimated Value
Home Financials for this Owner
Home Financials are based on the most recent Mortgage that was taken out on this home.
Original Mortgage
$356,000
Interest Rate
9.58%
Mortgage Type
Purchase Money Mortgage
Create a Home Valuation Report for This Property
The Home Valuation Report is an in-depth analysis detailing your home's value as well as a comparison with similar homes in the area
Home Values in the Area
Average Home Value in this Area
Purchase History
| Date | Buyer | Sale Price | Title Company |
|---|---|---|---|
| Atwood James A | $445,000 | -- |
Source: Public Records
Mortgage History
| Date | Status | Borrower | Loan Amount |
|---|---|---|---|
| Open | Atwood James A | $349,500 | |
| Closed | Atwood James A | $356,000 |
Source: Public Records
Tax History
| Year | Tax Paid | Tax Assessment Tax Assessment Total Assessment is a certain percentage of the fair market value that is determined by local assessors to be the total taxable value of land and additions on the property. | Land | Improvement |
|---|---|---|---|---|
| 2025 | $55,277 | $4,380,100 | $580,000 | $3,800,100 |
| 2024 | $50,975 | $4,078,000 | $505,200 | $3,572,800 |
| 2023 | $45,405 | $3,536,200 | $438,800 | $3,097,400 |
| 2022 | $42,158 | $3,157,900 | $438,800 | $2,719,100 |
| 2021 | $38,664 | $2,828,400 | $398,800 | $2,429,600 |
| 2020 | $38,183 | $2,783,000 | $404,300 | $2,378,700 |
| 2019 | $37,546 | $2,653,400 | $425,100 | $2,228,300 |
| 2018 | $39,180 | $2,692,800 | $464,500 | $2,228,300 |
| 2017 | $36,764 | $2,490,800 | $370,800 | $2,120,000 |
| 2016 | $35,797 | $2,311,000 | $325,100 | $1,985,900 |
| 2015 | $35,579 | $2,241,900 | $310,500 | $1,931,400 |
| 2014 | $34,427 | $2,141,000 | $310,500 | $1,830,500 |
Source: Public Records
Map
Nearby Homes
- 570 Bridge St
- 47 Bemis Rd
- 47 Village Ave Unit 203
- 37 Horrigan Dr Unit 1
- 57 Horrigan Dr Unit 3
- 20 Shuttleworth Place
- 20-35 Shuttleworth Place
- 44 Court St
- 35 Shuttleworth Place
- 66 Horrigan Dr Unit 25
- 27 Pine St
- 80 Horrigan Dr Unit 24
- 46 Church St
- 86 Horrigan Dr Unit 23
- 87 Horrigan Dr Unit 8
- 75 Bingham Ave
- 441 Washington St Unit 301
- 441 Washington St Unit 302
- 165 Highland St Unit 165
- 1133 High
Your Personal Tour Guide
Ask me questions while you tour the home.