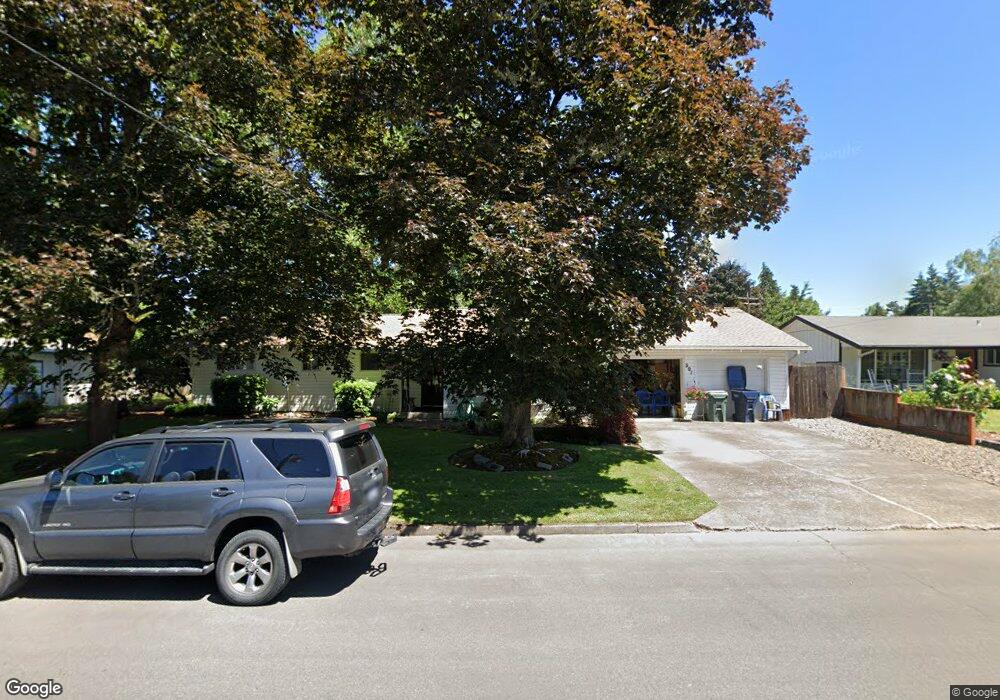
591 Craven St N Monmouth, OR 97361
Estimated Value: $437,000 - $467,000
5
Beds
2
Baths
1,836
Sq Ft
$246/Sq Ft
Est. Value
About This Home
This home is located at 591 Craven St N, Monmouth, OR 97361 and is currently estimated at $451,607, approximately $245 per square foot. 591 Craven St N is a home located in Polk County with nearby schools including Monmouth Elementary School, Talmadge Middle School, and Central High School.
Ownership History
Date
Name
Owned For
Owner Type
Purchase Details
Closed on
Jan 12, 2011
Sold by
Lieuallen Rosemarie A
Bought by
Lieuallen Rosemarie and Rosemarie Lieuallen Trust
Current Estimated Value
Create a Home Valuation Report for This Property
The Home Valuation Report is an in-depth analysis detailing your home's value as well as a comparison with similar homes in the area
Home Values in the Area
Average Home Value in this Area
Purchase History
| Date | Buyer | Sale Price | Title Company |
|---|---|---|---|
| Lieuallen Rosemarie | -- | None Available |
Source: Public Records
Tax History Compared to Growth
Tax History
| Year | Tax Paid | Tax Assessment Tax Assessment Total Assessment is a certain percentage of the fair market value that is determined by local assessors to be the total taxable value of land and additions on the property. | Land | Improvement |
|---|---|---|---|---|
| 2025 | $3,580 | $215,790 | $58,290 | $157,500 |
| 2024 | $3,580 | $209,510 | $56,590 | $152,920 |
| 2023 | $3,728 | $203,410 | $54,940 | $148,470 |
| 2022 | $3,356 | $197,490 | $53,340 | $144,150 |
| 2021 | $3,318 | $191,740 | $51,780 | $139,960 |
| 2020 | $3,186 | $186,160 | $50,270 | $135,890 |
| 2019 | $3,093 | $180,740 | $48,810 | $131,930 |
| 2018 | $2,987 | $175,480 | $47,390 | $128,090 |
| 2017 | $2,970 | $170,370 | $46,010 | $124,360 |
| 2016 | $3,034 | $165,410 | $44,670 | $120,740 |
| 2015 | $2,901 | $160,600 | $43,370 | $117,230 |
| 2014 | $2,836 | $155,930 | $42,110 | $113,820 |
Source: Public Records
Map
Nearby Homes
- 751 Catron St N
- 1328 Alberta Ave E
- 952 Main St E
- 1329 Price Ln E
- 145 Ecols St N
- 348 Main St E
- 191 Catron St S
- 151 Edwards (#146) Rd S Unit 146
- 141 S 17th St Unit 61 St
- 141 S 17th St Unit 70 St
- 141 17th (#7) St S Unit 7
- 271 Clay St E
- 9650 Hoffman Rd
- 355 Jacobson Ct S
- 277 Edwards Rd S Unit 145
- 277 Edwards Rd S Unit 133
- 1370 Bentley St E
- Lot 1600 S 16th St
- 297 Main St W
- 505 Broad St S
- 563 Craven St N
- 623 Craven St N
- 604 Sacre Ln N
- 584 Sacre Ln N
- 620 Sacre Ln N
- 531 Craven St N
- 651 Craven St N
- 618 Craven St N
- 552 Sacre Ln N
- 560 Craven St N
- 652 Craven St N
- 650 Sacre Ln N
- 532 Craven St N
- 683 Craven St N
- 501 Craven St N
- 587 Sacre Ln N
- 617 High St N
- 585 High St N
- 684 Craven St N
- 615 Sacre Ln N