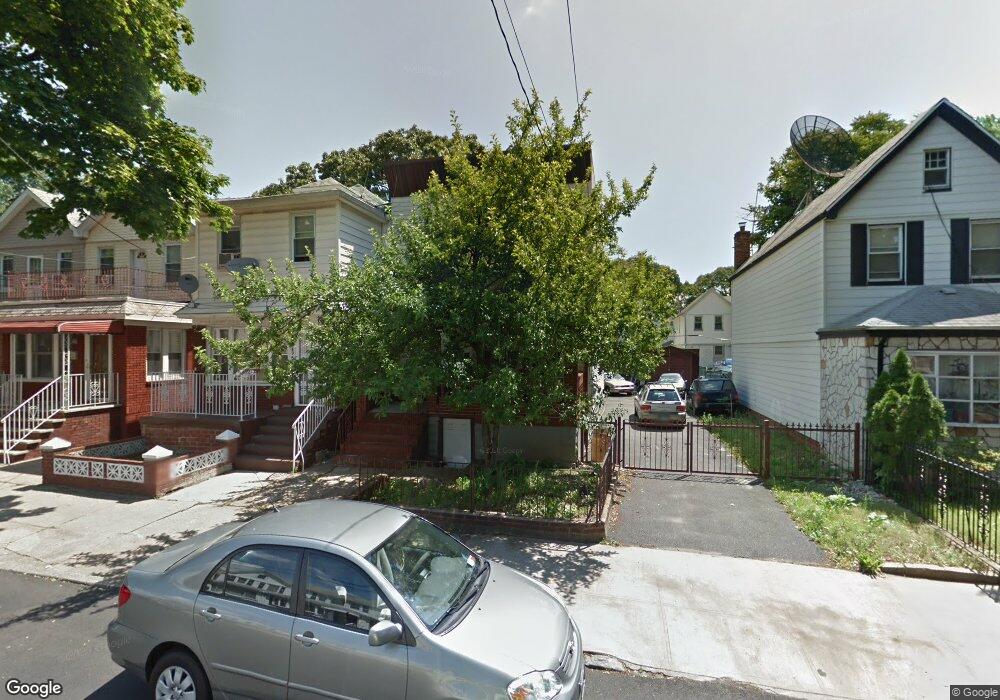
591 E 42nd St Brooklyn, NY 11203
East Flatbush NeighborhoodEstimated Value: $754,000 - $806,335
Studio
--
Bath
1,530
Sq Ft
$515/Sq Ft
Est. Value
About This Home
This home is located at 591 E 42nd St, Brooklyn, NY 11203 and is currently estimated at $788,584, approximately $515 per square foot. 591 E 42nd St is a home located in Kings County with nearby schools including P.S. 109, Andries Hudde School, and Central Brooklyn Ascend Charter.
Ownership History
Date
Name
Owned For
Owner Type
Purchase Details
Closed on
May 5, 2003
Sold by
Castor Lunie and Castor Marthone
Bought by
Lochard Carl
Current Estimated Value
Purchase Details
Closed on
Apr 5, 1999
Sold by
Marthone Fernande
Bought by
Marthone Fernande and Castor Lunie
Create a Home Valuation Report for This Property
The Home Valuation Report is an in-depth analysis detailing your home's value as well as a comparison with similar homes in the area
Home Values in the Area
Average Home Value in this Area
Purchase History
| Date | Buyer | Sale Price | Title Company |
|---|---|---|---|
| Lochard Carl | $275,000 | -- | |
| Lochard Carl | $275,000 | -- | |
| Marthone Fernande | -- | First American Title Ins Co | |
| Marthone Fernande | -- | First American Title Ins Co |
Source: Public Records
Mortgage History
| Date | Status | Borrower | Loan Amount |
|---|---|---|---|
| Closed | Lochard Carl | $0 |
Source: Public Records
Tax History
| Year | Tax Paid | Tax Assessment Tax Assessment Total Assessment is a certain percentage of the fair market value that is determined by local assessors to be the total taxable value of land and additions on the property. | Land | Improvement |
|---|---|---|---|---|
| 2025 | $6,431 | $59,280 | $15,660 | $43,620 |
| 2024 | $6,431 | $47,100 | $15,660 | $31,440 |
| 2023 | $6,119 | $51,900 | $15,660 | $36,240 |
| 2022 | $5,694 | $47,040 | $15,660 | $31,380 |
| 2021 | $5,652 | $41,340 | $15,660 | $25,680 |
| 2020 | $2,809 | $35,400 | $15,660 | $19,740 |
| 2019 | $5,533 | $37,620 | $15,660 | $21,960 |
| 2018 | $5,059 | $26,275 | $12,312 | $13,963 |
| 2017 | $4,790 | $24,966 | $11,472 | $13,494 |
| 2016 | $4,399 | $23,554 | $11,280 | $12,274 |
| 2015 | $2,621 | $23,554 | $13,799 | $9,755 |
| 2014 | $2,621 | $23,208 | $11,644 | $11,564 |
Source: Public Records
Map
Nearby Homes
Your Personal Tour Guide
Ask me questions while you tour the home.