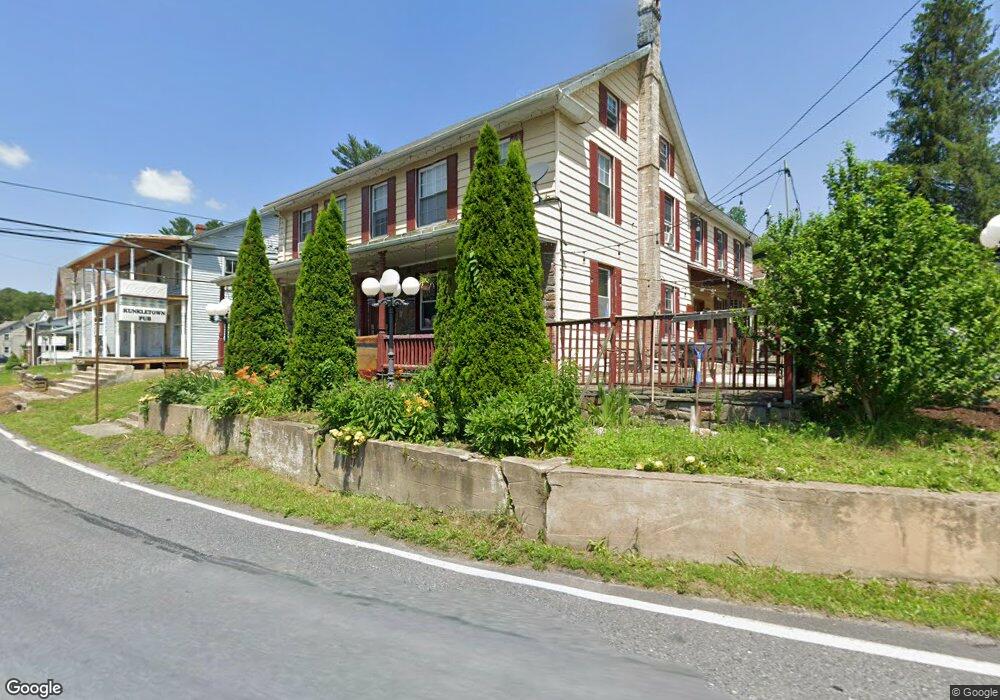
591 Kunkletown Rd Kunkletown, PA 18058
Estimated Value: $244,729
8
Beds
2
Baths
3,500
Sq Ft
$70/Sq Ft
Est. Value
About This Home
This home is located at 591 Kunkletown Rd, Kunkletown, PA 18058 and is currently estimated at $244,729, approximately $69 per square foot. 591 Kunkletown Rd is a home located in Monroe County with nearby schools including Pleasant Valley Intermediate School, Pleasant Valley Elementary School, and Pleasant Valley Middle School.
Ownership History
Date
Name
Owned For
Owner Type
Purchase Details
Closed on
Aug 1, 2013
Sold by
St Mathews U C C
Bought by
Pettit Gretchen Gannon
Current Estimated Value
Home Financials for this Owner
Home Financials are based on the most recent Mortgage that was taken out on this home.
Original Mortgage
$83,493
Outstanding Balance
$60,984
Interest Rate
3.95%
Mortgage Type
Commercial
Estimated Equity
$183,745
Purchase Details
Closed on
Mar 28, 2013
Sold by
Jupiter Tavern Inc
Bought by
St Matthews U C C
Purchase Details
Closed on
Oct 20, 2008
Sold by
Ryan James R and Ryan Susan M
Bought by
Kiejdo Bozena
Home Financials for this Owner
Home Financials are based on the most recent Mortgage that was taken out on this home.
Original Mortgage
$215,000
Interest Rate
6.03%
Mortgage Type
Future Advance Clause Open End Mortgage
Create a Home Valuation Report for This Property
The Home Valuation Report is an in-depth analysis detailing your home's value as well as a comparison with similar homes in the area
Home Values in the Area
Average Home Value in this Area
Purchase History
| Date | Buyer | Sale Price | Title Company |
|---|---|---|---|
| Pettit Gretchen Gannon | $103,498 | None Available | |
| St Matthews U C C | $110,000 | None Available | |
| Kiejdo Bozena | $200,000 | None Available |
Source: Public Records
Mortgage History
| Date | Status | Borrower | Loan Amount |
|---|---|---|---|
| Open | Pettit Gretchen Gannon | $83,493 | |
| Previous Owner | Kiejdo Bozena | $215,000 |
Source: Public Records
Tax History Compared to Growth
Tax History
| Year | Tax Paid | Tax Assessment Tax Assessment Total Assessment is a certain percentage of the fair market value that is determined by local assessors to be the total taxable value of land and additions on the property. | Land | Improvement |
|---|---|---|---|---|
| 2025 | $1,516 | $197,520 | $28,400 | $169,120 |
| 2024 | $1,220 | $197,520 | $28,400 | $169,120 |
| 2023 | $5,938 | $197,520 | $28,400 | $169,120 |
| 2022 | $5,726 | $197,520 | $28,400 | $169,120 |
| 2021 | $5,601 | $197,520 | $28,400 | $169,120 |
| 2020 | $1,023 | $197,520 | $28,400 | $169,120 |
| 2019 | $4,966 | $27,510 | $4,720 | $22,790 |
| 2018 | $4,911 | $27,510 | $4,720 | $22,790 |
| 2017 | $4,911 | $27,510 | $4,720 | $22,790 |
| 2016 | $846 | $27,510 | $4,720 | $22,790 |
| 2015 | -- | $27,510 | $4,720 | $22,790 |
| 2014 | -- | $27,510 | $4,720 | $22,790 |
Source: Public Records
Map
Nearby Homes
- Lot 38 Woodview Hills
- 295 Railbed Trail
- 131 Lobach Ln
- 1182 Quail Rd
- 5990 Little Gap Rd
- 2650 57 Rd
- 142 Pine Grove Rd
- 5138 Walnut St
- 120 Upper Greenhill Rd
- CO Line Forest Dr
- 584 Pheasant Rd
- 150 Red Oak Dr
- Lot 32 Greenview Ct
- 311 Stacia Way
- 969 Hideaway Hill Rd
- 0 Benders Dr
- 998 Newichawnoe St
- 1243 Blue Mountain Cir
- 209 Floyd Dr
- 4400 Little Gap Rd
- 589 Kunkletown Rd
- T413 T 413
- 594 Kunkletown Rd
- 585 Kunkletown Rd
- 583 Kunkletown Rd
- 440 H T Y Rd
- 578 Kunkletown Rd
- 574 Kunkletown Rd
- 613 Kunkletown Rd
- 570 Kunkletown Rd
- 617 Kunkletown Rd
- 104 Barlieb Ct
- 619 Kunkletown Rd
- 619 Kunkletown Rd
- 619 Kunkletown Rd
- 0 Church & Borger Rd Unit 659842
- 122 Sandy Hill Path
- 621 Kunkletown Rd
- 3 Church Rd
- 63 Rr 2