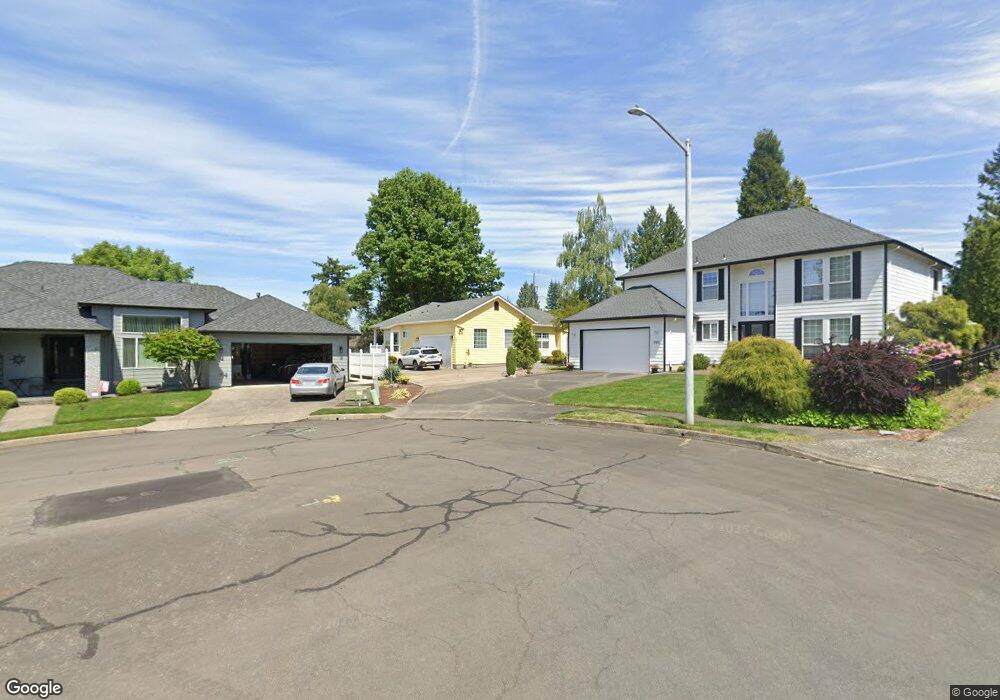
591 NW Mawrcrest Place Gresham, OR 97030
Northwest Gresham NeighborhoodEstimated Value: $474,000 - $499,000
3
Beds
3
Baths
1,714
Sq Ft
$282/Sq Ft
Est. Value
About This Home
This home is located at 591 NW Mawrcrest Place, Gresham, OR 97030 and is currently estimated at $482,666, approximately $281 per square foot. 591 NW Mawrcrest Place is a home located in Multnomah County with nearby schools including North Gresham Elementary School, Clear Creek Middle School, and Gresham High School.
Ownership History
Date
Name
Owned For
Owner Type
Purchase Details
Closed on
Mar 27, 2015
Sold by
Dunn Geri
Bought by
Smith Judith E
Current Estimated Value
Home Financials for this Owner
Home Financials are based on the most recent Mortgage that was taken out on this home.
Original Mortgage
$203,800
Outstanding Balance
$155,459
Interest Rate
3.65%
Mortgage Type
New Conventional
Estimated Equity
$327,207
Purchase Details
Closed on
Mar 21, 2012
Sold by
Delance Shirley M
Bought by
Delance Shirley M and Shirley M Lee Delance Revocable Living T
Purchase Details
Closed on
Oct 31, 2007
Sold by
Swalko Anna Mae
Bought by
Delance Shirley M
Home Financials for this Owner
Home Financials are based on the most recent Mortgage that was taken out on this home.
Original Mortgage
$305,000
Interest Rate
6.12%
Mortgage Type
Purchase Money Mortgage
Purchase Details
Closed on
May 30, 1997
Sold by
Swalko Matthew L
Bought by
Swalko Matthew L and Swalko Anna Mae
Create a Home Valuation Report for This Property
The Home Valuation Report is an in-depth analysis detailing your home's value as well as a comparison with similar homes in the area
Home Values in the Area
Average Home Value in this Area
Purchase History
| Date | Buyer | Sale Price | Title Company |
|---|---|---|---|
| Smith Judith E | $254,750 | Fidelity National Title | |
| Delance Shirley M | -- | None Available | |
| Delance Shirley M | $305,000 | Fidelity Natl Title Co Of Or | |
| Swalko Matthew L | -- | -- |
Source: Public Records
Mortgage History
| Date | Status | Borrower | Loan Amount |
|---|---|---|---|
| Open | Smith Judith E | $203,800 | |
| Previous Owner | Delance Shirley M | $305,000 |
Source: Public Records
Tax History
| Year | Tax Paid | Tax Assessment Tax Assessment Total Assessment is a certain percentage of the fair market value that is determined by local assessors to be the total taxable value of land and additions on the property. | Land | Improvement |
|---|---|---|---|---|
| 2025 | $6,150 | $302,230 | -- | -- |
| 2024 | $5,887 | $293,430 | -- | -- |
| 2023 | $5,364 | $284,890 | $0 | $0 |
| 2022 | $5,214 | $276,600 | $0 | $0 |
| 2021 | $5,083 | $268,550 | $0 | $0 |
| 2020 | $4,782 | $260,730 | $0 | $0 |
| 2019 | $4,657 | $253,140 | $0 | $0 |
| 2018 | $4,441 | $245,770 | $0 | $0 |
| 2017 | $4,260 | $238,620 | $0 | $0 |
| 2016 | $3,756 | $231,670 | $0 | $0 |
Source: Public Records
Map
Nearby Homes
- 2095 NW 3rd St
- 970 NW Wonderview Ct Unit 980
- 284 NW Mawrcrest Ave
- 256 NW Mawrcrest Ave
- 236 NW Mawrcrest Ave
- 252 NW Eleven Mile Ave
- 1745 NW 7th Place
- 185 NW Mawrcrest Ave
- 181 NW Mawrcrest Ave
- 2543 NW 2nd Terrace
- 2437 NW 1st Dr
- 2455 NW 1st Dr
- 2469 NW 1st Dr
- 2477 NW 1st Dr
- 85 NW Mawrcrest Ave
- 63 NW Mawrcrest Ave
- 21 NW Mawrcrest Ave
- 70 NW Birdsdale Ave
- 44 SW Birdsdale Dr
- 1325 NW 9th St
- 592 NW Mawrcrest Place
- 592 NW Mawcrest Place
- 581 NW Mawrcrest Place
- 2220 NW 7th Place Unit 2230
- 2260 NW 7th Place
- 2198 NW 6th Place
- 582 NW Mawrcrest Place
- 571 NW Mawrcrest Place
- 560 NW Birdsdale Ave
- 2320 NW 7th Place
- 572 NW Mawrcrest Place
- 2229 NW 5th St
- 725 NW Birdsdale Ave
- 561 NW Mawrcrest Place
- 2178 NW 6th Place
- 2259 NW 5th St
- 2185 NW 6th Place
- 2245 NW 7th Place
- 540 NW Birdsdale Quiet
- 540 NW Birdsdale Ave
Your Personal Tour Guide
Ask me questions while you tour the home.