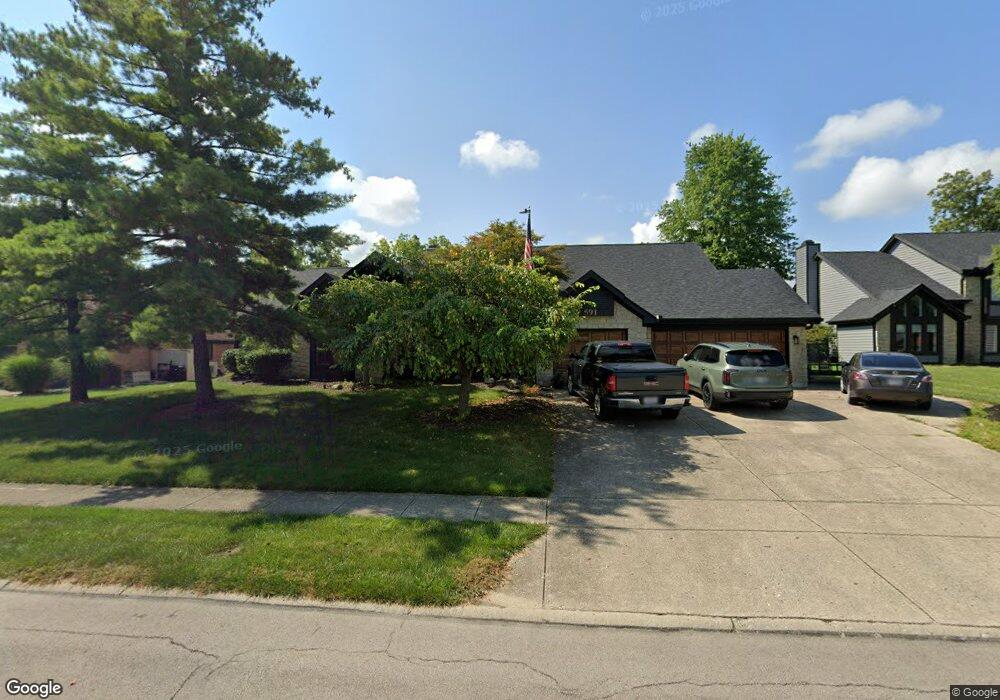
591 Oaknoll Dr Springboro, OH 45066
Estimated Value: $489,000 - $505,000
4
Beds
3
Baths
3,167
Sq Ft
$157/Sq Ft
Est. Value
About This Home
This home is located at 591 Oaknoll Dr, Springboro, OH 45066 and is currently estimated at $498,029, approximately $157 per square foot. 591 Oaknoll Dr is a home located in Warren County with nearby schools including Clearcreek Elementary School, Springboro Intermediate School, and Springboro Junior High School.
Ownership History
Date
Name
Owned For
Owner Type
Purchase Details
Closed on
Oct 1, 2021
Sold by
Wiessinger Joanne M
Bought by
Wolf Kent G and Wolf Lori A
Current Estimated Value
Home Financials for this Owner
Home Financials are based on the most recent Mortgage that was taken out on this home.
Original Mortgage
$365,750
Outstanding Balance
$271,631
Interest Rate
2.1%
Mortgage Type
New Conventional
Estimated Equity
$226,398
Purchase Details
Closed on
Feb 18, 1988
Sold by
Peth Peth and Peth Nick A
Bought by
Russell Wiessinger and Russell L.
Purchase Details
Closed on
Sep 18, 1987
Sold by
Irving Roger and Irving B.
Bought by
Peth Peth and Peth Nick A
Purchase Details
Closed on
Jan 10, 1985
Sold by
Highpoint Development Co
Bought by
Irving Roger and Irving B.
Purchase Details
Closed on
Jul 3, 1980
Sold by
Highpoint Development Co
Create a Home Valuation Report for This Property
The Home Valuation Report is an in-depth analysis detailing your home's value as well as a comparison with similar homes in the area
Home Values in the Area
Average Home Value in this Area
Purchase History
| Date | Buyer | Sale Price | Title Company |
|---|---|---|---|
| Wolf Kent G | $401,150 | Home Services Title Llc | |
| Russell Wiessinger | $166,000 | -- | |
| Peth Peth | $26,500 | -- | |
| Irving Roger | -- | -- | |
| -- | -- | -- |
Source: Public Records
Mortgage History
| Date | Status | Borrower | Loan Amount |
|---|---|---|---|
| Open | Wolf Kent G | $365,750 |
Source: Public Records
Tax History
| Year | Tax Paid | Tax Assessment Tax Assessment Total Assessment is a certain percentage of the fair market value that is determined by local assessors to be the total taxable value of land and additions on the property. | Land | Improvement |
|---|---|---|---|---|
| 2025 | $6,251 | $153,290 | $31,500 | $121,790 |
| 2024 | $6,251 | $153,290 | $31,500 | $121,790 |
| 2023 | $5,643 | $126,983 | $17,220 | $109,763 |
| 2022 | $5,229 | $120,442 | $17,220 | $103,222 |
| 2021 | $4,564 | $120,442 | $17,220 | $103,222 |
| 2020 | $4,212 | $97,920 | $14,000 | $83,920 |
| 2019 | $3,903 | $97,920 | $14,000 | $83,920 |
| 2018 | $3,895 | $97,920 | $14,000 | $83,920 |
| 2017 | $3,731 | $85,463 | $12,429 | $73,035 |
| 2016 | $3,883 | $85,463 | $12,429 | $73,035 |
| 2015 | $3,893 | $85,463 | $12,429 | $73,035 |
| 2014 | $3,893 | $81,390 | $11,840 | $69,560 |
| 2013 | $3,891 | $96,260 | $14,000 | $82,260 |
Source: Public Records
Map
Nearby Homes
- 8638 Sycamore Trails Dr
- 811 Wind Bluff Point
- 8711 Nicole Ln
- 701 Grand Wood Ct
- 678 Grand Wood Ct
- 9048 Bedford Ct
- 855 Willow Oak Ct
- 8234 Voltaire Ct
- 9195 Glenridge Blvd
- 0 Voltaire Ct Unit 1863060
- 710 White Cedar Way
- 91 Hillcrest Dr
- 9101 Remy Ct
- 9079 Bunnell Hill Rd
- 1198 Normandy Rue
- 9378 Remington Hill Rd
- 1211 Normandy Rue
- 9155 Remy Ct
- 1214 Normandy Rue
- 1226 Normandy Rue
- 609 Oaknoll Dr
- 571 Oaknoll Dr
- 627 Oaknoll Dr
- 594 Oaknoll Dr
- 561 Oaknoll Dr
- 576 Oaknoll Dr
- 610 Oaknoll Dr
- 8565 Sycamore Trails Dr
- 555 Oaknoll Dr
- 560 Oaknoll Dr
- 636 Oaknoll Dr
- 556 Oaknoll Dr
- 8551 Sycamore Trails Dr
- 8625 Sycamore Trails Dr
- 8554 Silver Oak Ct
- 591 Highpoint Dr
- 573 Highpoint Dr
- 397 Patton Dr
- 603 Highpoint Dr
- 557 Highpoint Dr
Your Personal Tour Guide
Ask me questions while you tour the home.