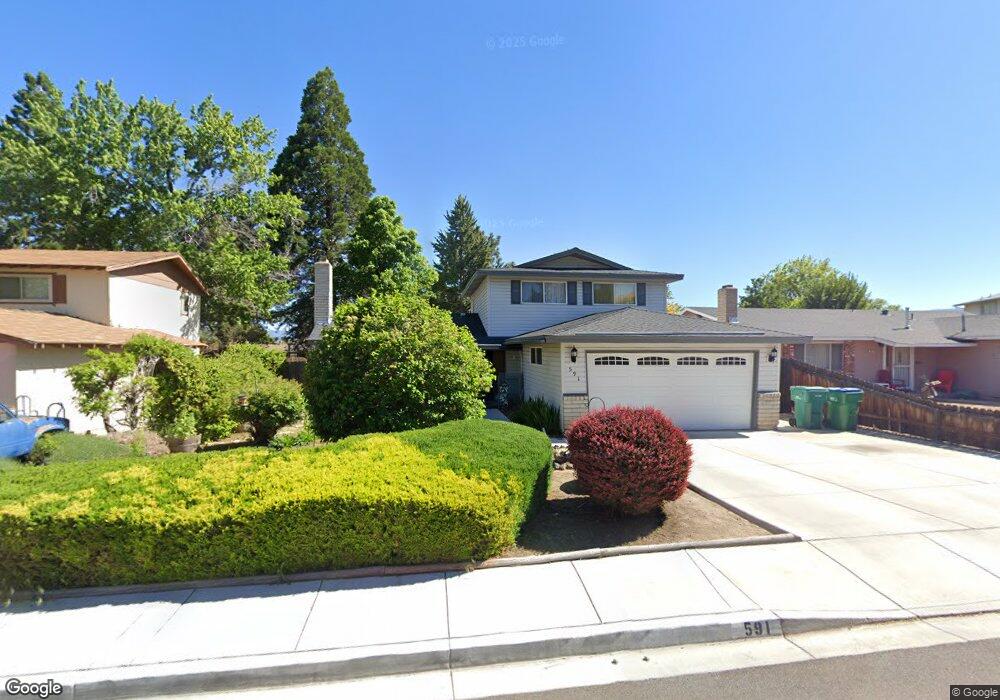
591 Penny Way Sparks, NV 89431
McCarran Boulevard-Probasco NeighborhoodEstimated Value: $488,000 - $545,000
5
Beds
3
Baths
2,208
Sq Ft
$229/Sq Ft
Est. Value
About This Home
This home is located at 591 Penny Way, Sparks, NV 89431 and is currently estimated at $506,665, approximately $229 per square foot. 591 Penny Way is a home located in Washoe County with nearby schools including Hershal H. Beam Elementary School, Lena Juniper Elementary School, and Lou Mendive Middle School.
Ownership History
Date
Name
Owned For
Owner Type
Purchase Details
Closed on
May 14, 2024
Sold by
Kiserow Jack
Bought by
Duran Alexis and Duran Dylan
Current Estimated Value
Home Financials for this Owner
Home Financials are based on the most recent Mortgage that was taken out on this home.
Original Mortgage
$17,850
Outstanding Balance
$8,708
Interest Rate
6.82%
Mortgage Type
New Conventional
Estimated Equity
$497,957
Purchase Details
Closed on
Feb 7, 2023
Sold by
Kiserow Living Trust
Bought by
Kiserow Jack
Purchase Details
Closed on
Jan 19, 2012
Sold by
Kiserow John A and Kiserow Vicki Marrie
Bought by
Kiserow John A and Kiserow Vicki Marie
Purchase Details
Closed on
Mar 2, 1979
Sold by
Blasutta Pio and Blasutta Marie A
Bought by
Lopez Hermie F and Lopez Jacqueline R
Create a Home Valuation Report for This Property
The Home Valuation Report is an in-depth analysis detailing your home's value as well as a comparison with similar homes in the area
Home Values in the Area
Average Home Value in this Area
Purchase History
| Date | Buyer | Sale Price | Title Company |
|---|---|---|---|
| Duran Alexis | $510,000 | First American Title | |
| Kiserow Jack | -- | -- | |
| Kiserow John A | -- | None Available | |
| Kiserow John A | -- | None Available | |
| Lopez Hermie F | -- | Stewart Title |
Source: Public Records
Mortgage History
| Date | Status | Borrower | Loan Amount |
|---|---|---|---|
| Open | Duran Alexis | $17,850 | |
| Open | Duran Alexis | $500,762 |
Source: Public Records
Tax History Compared to Growth
Tax History
| Year | Tax Paid | Tax Assessment Tax Assessment Total Assessment is a certain percentage of the fair market value that is determined by local assessors to be the total taxable value of land and additions on the property. | Land | Improvement |
|---|---|---|---|---|
| 2025 | $1,496 | $65,066 | $36,715 | $28,351 |
| 2024 | $1,496 | $62,649 | $34,755 | $27,894 |
| 2023 | $1,458 | $60,784 | $34,930 | $25,854 |
| 2022 | $1,414 | $49,496 | $28,455 | $21,041 |
| 2021 | $1,373 | $41,287 | $19,635 | $21,652 |
| 2020 | $1,332 | $40,237 | $17,850 | $22,387 |
| 2019 | $1,292 | $41,101 | $18,725 | $22,376 |
| 2018 | $1,255 | $36,066 | $13,545 | $22,521 |
| 2017 | $1,219 | $35,253 | $12,075 | $23,178 |
| 2016 | $1,189 | $35,861 | $11,550 | $24,311 |
| 2015 | $302 | $34,624 | $9,415 | $25,209 |
| 2014 | $1,151 | $32,598 | $7,980 | $24,618 |
| 2013 | -- | $30,742 | $5,985 | $24,757 |
Source: Public Records
Map
Nearby Homes
- 780 Emerson Way
- 3465 Dawn Cir
- 465 Lenwood Dr
- 5650 Wedekind Rd
- 3607 Keogh Dr
- 3545 4th St
- 3252 Holman Way
- 3245 Elaine Way
- 119 Devere Way
- 3269 Valley Forge Way
- 5530 High Rock Way
- 120 E Lenwood Dr
- 1125 Dodson Way
- 3595 Rocky Ridge Ct
- 10 Sheridan Way
- 0 N Mccarran Blvd Unit 250052909
- 1160 York Way
- 1110 Xman Way
- 1345 Plymouth Way
- 2865 Patrice Dr
- 623 Penny Way
- 563 Penny Way
- 562 Steffanie Way
- 598 Steffanie Way
- 531 Penny Way
- 3330 Montecito Dr
- 534 Steffanie Way Unit 6A
- 642 Steffanie Way
- 592 Penny Way
- 624 Penny Way Unit n/a
- 624 Penny Way
- 536 Penny Way
- 516 Steffanie Way
- 517 Penny Way
- 517 Penny Way Unit NV
- 632 Penny Way
- 3324 Montecito Dr
- 518 Penny Way
- 501 Penny Way
- 644 Penny Way