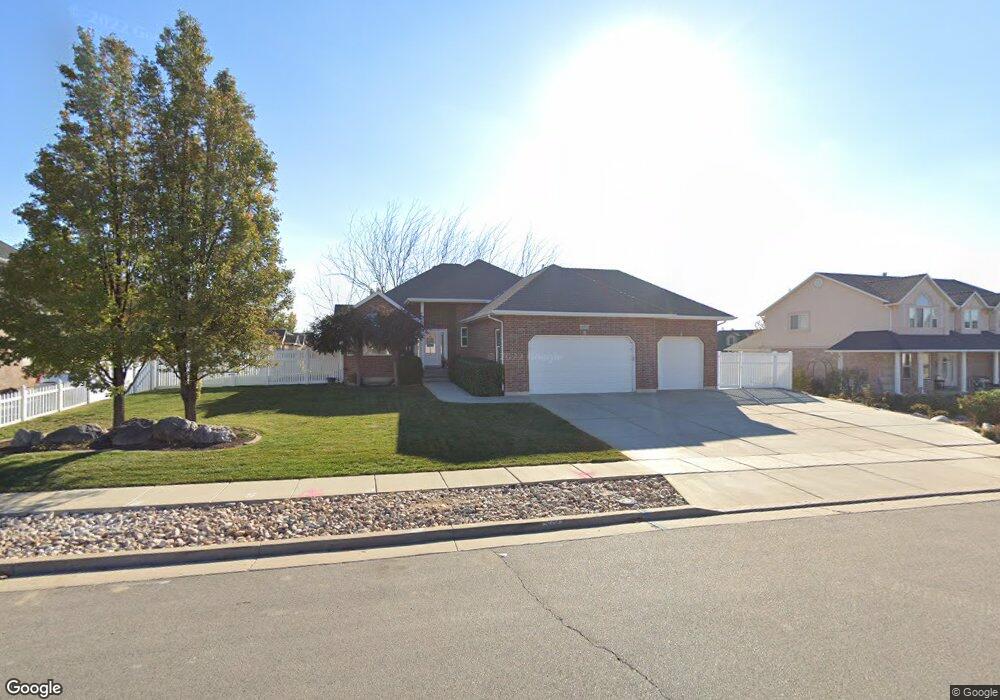
591 W 2300 S Syracuse, UT 84075
Estimated Value: $660,000 - $689,000
3
Beds
2
Baths
1,936
Sq Ft
$348/Sq Ft
Est. Value
About This Home
This home is located at 591 W 2300 S, Syracuse, UT 84075 and is currently estimated at $674,115, approximately $348 per square foot. 591 W 2300 S is a home located in Davis County with nearby schools including Bluff Ridge Elementary, Legacy Junior High School, and Clearfield High School.
Ownership History
Date
Name
Owned For
Owner Type
Purchase Details
Closed on
Jul 9, 2012
Sold by
Banks Rodney D and Banks Nicole
Bought by
Banks Rodney D and Banks Nicole
Current Estimated Value
Home Financials for this Owner
Home Financials are based on the most recent Mortgage that was taken out on this home.
Original Mortgage
$224,800
Outstanding Balance
$95,195
Interest Rate
3.74%
Mortgage Type
New Conventional
Estimated Equity
$578,920
Purchase Details
Closed on
Aug 24, 1998
Sold by
T B E Investments Llc
Bought by
Thurgood Richard G and Thurgood Robyn
Create a Home Valuation Report for This Property
The Home Valuation Report is an in-depth analysis detailing your home's value as well as a comparison with similar homes in the area
Home Values in the Area
Average Home Value in this Area
Purchase History
| Date | Buyer | Sale Price | Title Company |
|---|---|---|---|
| Banks Rodney D | -- | Hickman Land Title C | |
| Thurgood Richard G | -- | Bonneville Title Company Inc |
Source: Public Records
Mortgage History
| Date | Status | Borrower | Loan Amount |
|---|---|---|---|
| Open | Banks Rodney D | $224,800 |
Source: Public Records
Tax History Compared to Growth
Tax History
| Year | Tax Paid | Tax Assessment Tax Assessment Total Assessment is a certain percentage of the fair market value that is determined by local assessors to be the total taxable value of land and additions on the property. | Land | Improvement |
|---|---|---|---|---|
| 2025 | $3,341 | $322,300 | $128,486 | $193,814 |
| 2024 | $3,182 | $309,100 | $109,715 | $199,385 |
| 2023 | $3,079 | $545,000 | $152,674 | $392,326 |
| 2022 | $3,112 | $301,950 | $87,406 | $214,544 |
| 2021 | $2,690 | $404,000 | $129,562 | $274,438 |
| 2020 | $2,434 | $354,000 | $111,124 | $242,876 |
| 2019 | $2,361 | $339,000 | $110,748 | $228,252 |
| 2018 | $2,365 | $337,000 | $105,810 | $231,190 |
| 2016 | $2,032 | $151,855 | $40,534 | $111,321 |
| 2015 | $2,062 | $146,740 | $40,534 | $106,206 |
| 2014 | $2,009 | $145,708 | $40,534 | $105,174 |
| 2013 | -- | $145,177 | $38,525 | $106,652 |
Source: Public Records
Map
Nearby Homes