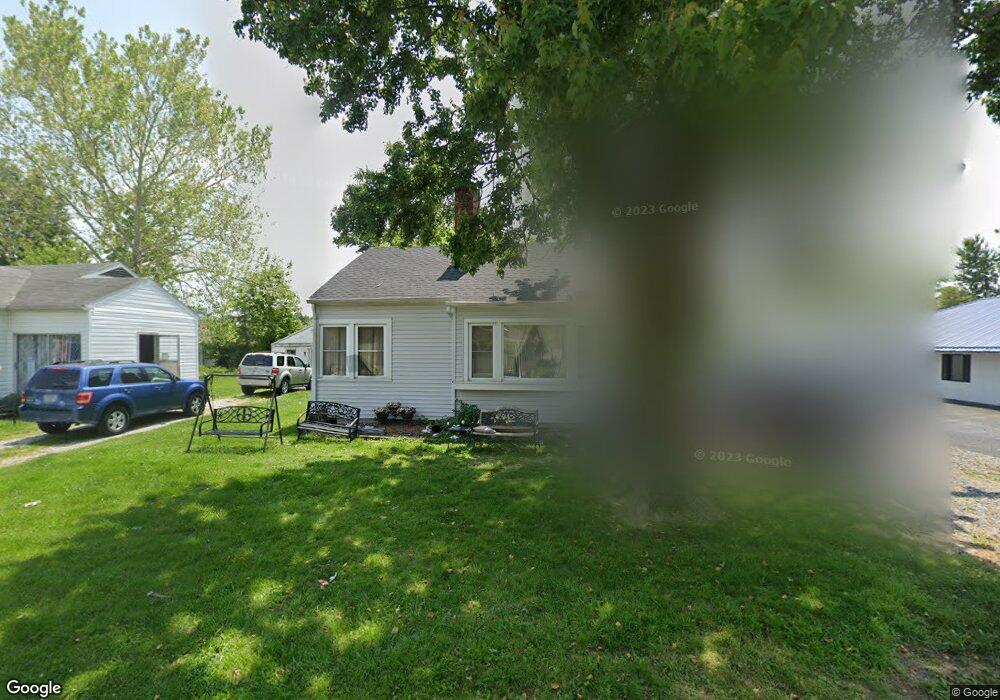
591 W Maple St Austin, IN 47102
Estimated Value: $92,000 - $139,000
2
Beds
1
Bath
806
Sq Ft
$144/Sq Ft
Est. Value
About This Home
This home is located at 591 W Maple St, Austin, IN 47102 and is currently estimated at $116,320, approximately $144 per square foot. 591 W Maple St is a home located in Scott County with nearby schools including Austin Elementary School, Austin Middle School, and Austin High School.
Ownership History
Date
Name
Owned For
Owner Type
Purchase Details
Closed on
Dec 7, 2007
Sold by
Wright Ronald G
Bought by
Spicer Edward D
Current Estimated Value
Home Financials for this Owner
Home Financials are based on the most recent Mortgage that was taken out on this home.
Original Mortgage
$57,856
Outstanding Balance
$36,009
Interest Rate
6.33%
Mortgage Type
VA
Estimated Equity
$80,311
Purchase Details
Closed on
Nov 21, 2007
Sold by
Wright Ronald G and Wright Randall G
Bought by
Spicer Edward D
Home Financials for this Owner
Home Financials are based on the most recent Mortgage that was taken out on this home.
Original Mortgage
$57,856
Outstanding Balance
$36,009
Interest Rate
6.33%
Mortgage Type
VA
Estimated Equity
$80,311
Create a Home Valuation Report for This Property
The Home Valuation Report is an in-depth analysis detailing your home's value as well as a comparison with similar homes in the area
Home Values in the Area
Average Home Value in this Area
Purchase History
| Date | Buyer | Sale Price | Title Company |
|---|---|---|---|
| Spicer Edward D | $56,500 | Mattingly-Ford Title Service | |
| Spicer Edward D | -- | None Available |
Source: Public Records
Mortgage History
| Date | Status | Borrower | Loan Amount |
|---|---|---|---|
| Open | Spicer Edward D | $57,856 |
Source: Public Records
Tax History
| Year | Tax Paid | Tax Assessment Tax Assessment Total Assessment is a certain percentage of the fair market value that is determined by local assessors to be the total taxable value of land and additions on the property. | Land | Improvement |
|---|---|---|---|---|
| 2024 | $329 | $38,500 | $6,500 | $32,000 |
| 2023 | $320 | $39,200 | $6,500 | $32,700 |
| 2022 | $214 | $38,200 | $6,500 | $31,700 |
| 2021 | $199 | $36,500 | $6,500 | $30,000 |
| 2020 | $549 | $38,000 | $6,500 | $31,500 |
| 2019 | $599 | $36,500 | $6,500 | $30,000 |
| 2018 | $559 | $36,200 | $6,500 | $29,700 |
| 2017 | $175 | $34,900 | $6,500 | $28,400 |
| 2016 | $448 | $35,700 | $6,500 | $29,200 |
| 2014 | $219 | $37,200 | $6,200 | $31,000 |
| 2013 | $219 | $37,200 | $6,200 | $31,000 |
Source: Public Records
Map
Nearby Homes
Your Personal Tour Guide
Ask me questions while you tour the home.