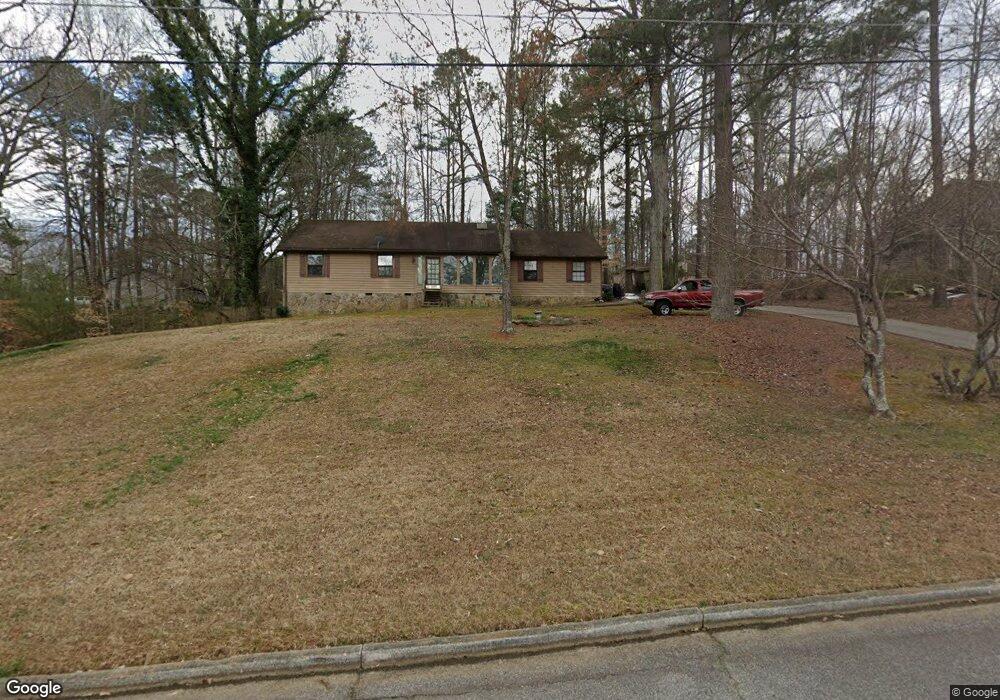
5910 Catawba Way Unit 3 Atlanta, GA 30349
Estimated Value: $222,649 - $248,000
3
Beds
2
Baths
1,274
Sq Ft
$187/Sq Ft
Est. Value
About This Home
This home is located at 5910 Catawba Way Unit 3, Atlanta, GA 30349 and is currently estimated at $237,912, approximately $186 per square foot. 5910 Catawba Way Unit 3 is a home located in Fulton County with nearby schools including Wolf Creek Elementary, Sandtown Middle School, and Langston Hughes High School.
Ownership History
Date
Name
Owned For
Owner Type
Purchase Details
Closed on
Aug 27, 2007
Sold by
Hud & Housing Of Urban Dev
Bought by
Kindred Albert L
Current Estimated Value
Home Financials for this Owner
Home Financials are based on the most recent Mortgage that was taken out on this home.
Original Mortgage
$76,410
Outstanding Balance
$59,755
Interest Rate
11.95%
Mortgage Type
New Conventional
Estimated Equity
$178,157
Purchase Details
Closed on
Sep 5, 2006
Sold by
Wells Fargo Bank Na
Bought by
Secretary Of Hud
Purchase Details
Closed on
Aug 30, 1999
Sold by
Johnston David L and Johnston Mary E
Bought by
Pittman Shirley A
Home Financials for this Owner
Home Financials are based on the most recent Mortgage that was taken out on this home.
Original Mortgage
$111,043
Interest Rate
7.73%
Mortgage Type
FHA
Create a Home Valuation Report for This Property
The Home Valuation Report is an in-depth analysis detailing your home's value as well as a comparison with similar homes in the area
Home Values in the Area
Average Home Value in this Area
Purchase History
| Date | Buyer | Sale Price | Title Company |
|---|---|---|---|
| Kindred Albert L | -- | -- | |
| Secretary Of Hud | -- | -- | |
| Wells Fargo Bank Na | $123,051 | -- | |
| Pittman Shirley A | $112,000 | -- |
Source: Public Records
Mortgage History
| Date | Status | Borrower | Loan Amount |
|---|---|---|---|
| Open | Kindred Albert L | $76,410 | |
| Previous Owner | Pittman Shirley A | $111,043 |
Source: Public Records
Tax History Compared to Growth
Tax History
| Year | Tax Paid | Tax Assessment Tax Assessment Total Assessment is a certain percentage of the fair market value that is determined by local assessors to be the total taxable value of land and additions on the property. | Land | Improvement |
|---|---|---|---|---|
| 2025 | $2,815 | $70,520 | $17,720 | $52,800 |
| 2023 | $1,839 | $65,160 | $17,040 | $48,120 |
| 2022 | $2,555 | $65,160 | $17,040 | $48,120 |
| 2021 | $1,444 | $36,080 | $11,360 | $24,720 |
| 2020 | $1,452 | $35,680 | $11,240 | $24,440 |
| 2019 | $1,384 | $35,040 | $11,040 | $24,000 |
| 2018 | $1,361 | $34,200 | $10,760 | $23,440 |
| 2017 | $905 | $22,200 | $4,080 | $18,120 |
| 2016 | $905 | $22,200 | $4,080 | $18,120 |
| 2015 | $910 | $22,200 | $4,080 | $18,120 |
| 2014 | $1,130 | $26,200 | $4,080 | $22,120 |
Source: Public Records
Map
Nearby Homes
- 4300 Watauga Dr
- 614 Maltese Dr
- 4349 Sublime Trail
- 617 Maltese Dr
- 4027 Dinmont Chase
- 0 Derrick Rd SE Unit 10621019
- 0 Derrick Rd SE Unit 22713952
- 5688 Baffin Rd
- 4395 Stonewall Tell Rd
- 546100 Stonewall Tell Rd
- 5950 Lynfield Dr SW
- 5530 Rosehall Place
- 4085 Trimrose Ct
- 4085 Trimrose Ct Unit LOT 160
- 3945 Pittman Rd
- 4081 Trimrose Ct
- 4077 Trimrose Ct
- 5611 Rosehall Place
- 5611 Rosehall Place Unit 181
- Sapling Plan at Parkview Estates
- 4255 Watauga Dr
- 5920 Catawba Way
- 5920 Catawba Way
- 0 Watauga Dr Unit 7549882
- 0 Watauga Dr Unit 3161764
- 0 Watauga Dr Unit 7121180
- 0 Watauga Dr
- 415 Mendota Ct Unit 1
- 425 Mendota Ct Unit 1
- 4265 Watauga Dr
- 5915 Catawba Way
- 4245 Watauga Dr Unit 8
- 4245 Watauga Dr
- 5930 Catawba Way
- 5930 Catawba Way
- 4285 Watauga Dr Unit 1
- 5935 Catawba Way
- 5950 Catawba Way
- 430 Mendota Ct Unit 1
- 4260 Watauga Dr