5910 McCart Ranch Rd Elizabeth, CO 80107
Estimated Value: $1,476,308 - $1,550,000
5
Beds
3
Baths
4,694
Sq Ft
$325/Sq Ft
Est. Value
About This Home
This home is located at 5910 McCart Ranch Rd, Elizabeth, CO 80107 and is currently estimated at $1,523,827, approximately $324 per square foot. 5910 McCart Ranch Rd is a home located in Elbert County with nearby schools including Elizabeth High School.
Ownership History
Date
Name
Owned For
Owner Type
Purchase Details
Closed on
Dec 5, 2022
Sold by
Gantt Rene D
Bought by
Gantt Rene D
Current Estimated Value
Purchase Details
Closed on
May 4, 2011
Sold by
Folino William F and Folino Debra G
Bought by
Gantt Rene D and Mccracken Tom L
Purchase Details
Closed on
Mar 15, 2006
Sold by
Crow Faith E
Bought by
Folino William F and Folino Debra G
Home Financials for this Owner
Home Financials are based on the most recent Mortgage that was taken out on this home.
Original Mortgage
$480,000
Interest Rate
6.19%
Mortgage Type
New Conventional
Purchase Details
Closed on
Dec 19, 2003
Sold by
Soderbeck Wade and Soderbeck Shannel
Bought by
Folino William F and Folino Debra G
Home Financials for this Owner
Home Financials are based on the most recent Mortgage that was taken out on this home.
Original Mortgage
$322,700
Interest Rate
4.75%
Mortgage Type
Unknown
Create a Home Valuation Report for This Property
The Home Valuation Report is an in-depth analysis detailing your home's value as well as a comparison with similar homes in the area
Home Values in the Area
Average Home Value in this Area
Purchase History
| Date | Buyer | Sale Price | Title Company |
|---|---|---|---|
| Gantt Rene D | -- | -- | |
| Gantt Rene D | -- | -- | |
| Gantt Rene D | $560,000 | Land Title Guarantee Company | |
| Folino William F | -- | Land Title Guarantee Company | |
| Folino William F | $503,000 | -- |
Source: Public Records
Mortgage History
| Date | Status | Borrower | Loan Amount |
|---|---|---|---|
| Previous Owner | Folino William F | $480,000 | |
| Previous Owner | Folino William F | $322,700 | |
| Closed | Folino William F | $79,700 |
Source: Public Records
Tax History Compared to Growth
Tax History
| Year | Tax Paid | Tax Assessment Tax Assessment Total Assessment is a certain percentage of the fair market value that is determined by local assessors to be the total taxable value of land and additions on the property. | Land | Improvement |
|---|---|---|---|---|
| 2024 | $3,571 | $55,460 | $480 | $54,980 |
| 2023 | $3,571 | $55,460 | $480 | $54,980 |
| 2022 | $3,197 | $48,230 | $470 | $47,760 |
| 2021 | $3,886 | $50,380 | $510 | $49,870 |
| 2020 | $3,945 | $50,840 | $500 | $50,340 |
| 2019 | $3,948 | $50,840 | $500 | $50,340 |
| 2018 | $3,591 | $45,730 | $470 | $45,260 |
| 2017 | $3,596 | $45,730 | $470 | $45,260 |
| 2016 | $2,858 | $35,660 | $440 | $35,220 |
| 2015 | $2,907 | $35,660 | $440 | $35,220 |
| 2014 | $2,907 | $35,150 | $400 | $34,750 |
Source: Public Records
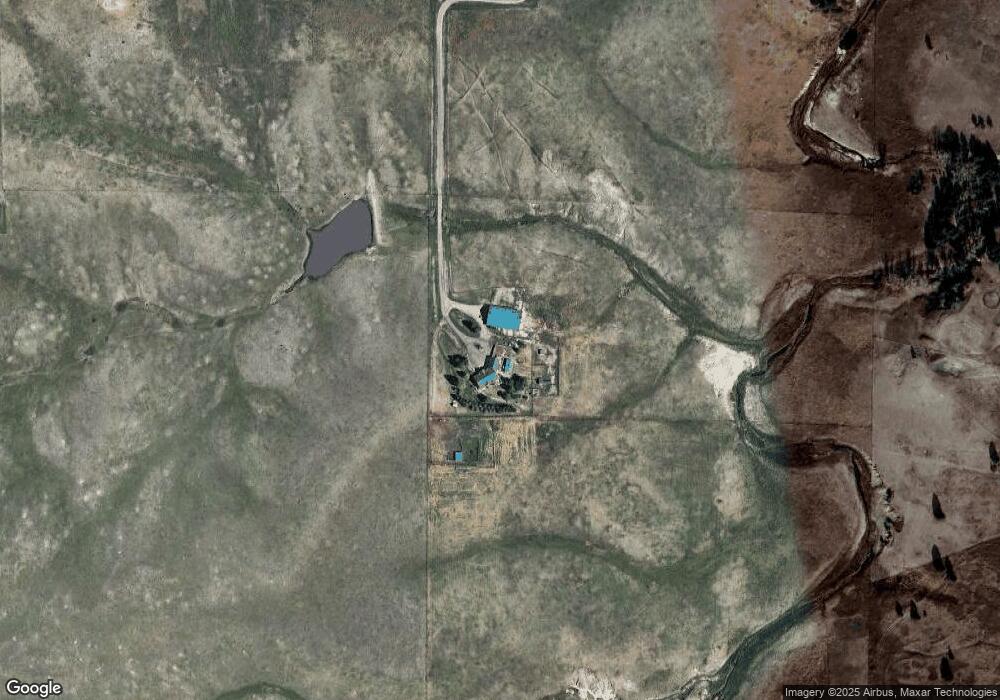
Map
Nearby Homes
- 5910 McCart Ranch Cir
- 0 County Road 25 Unit 2 REC8347785
- 0 County Road 25 Unit REC8082356
- 30886 County Road 17 21
- 7385 Pine Crest Dr
- 7573 Pine Crest Dr
- 4625 County Road 124
- 33591 Bow Meadows Cir
- 29684 County Road 17-21
- 34101 Columbine Trail E
- 34200 Columbine Trail W
- 34188 Goldenrod Cir
- 34050 Forest Park Dr
- 1353 S Elbert St
- 29326 County Road 17 21
- 33163 Expertise Trail Unit 8
- 33233 Expertise Trail Unit 7
- 34358 Goldenrod Cir
- 34295 Southern Cross Trail
- 1059 S Elbert St
- 6361 Arrowhead Trail
- 31900 Jenny Cir
- 6395 Arrowhead Trail
- 6423 Arrowhead Trail
- 6451 Arrowhead Trail
- 28242 Stone Horse Ranch Cir
- 6327 Arrowhead Trail
- 6479 Arrowhead Trail
- 6414 Arrowhead Trail
- 6435 Arrowhead Trail
- 5900 McCart Ranch Rd
- 6342 Arrowhead Trail
- 5755 Private Road 126
- 32210 Jenny Cir
- 6507 Arrowhead Trail
- 6281 Arrowhead Trail
- 6480 Arrowhead Trail
- 6526 Arrowhead Trail
- 6541 Arrowhead Trail
- 6188 Arrowhead Trail