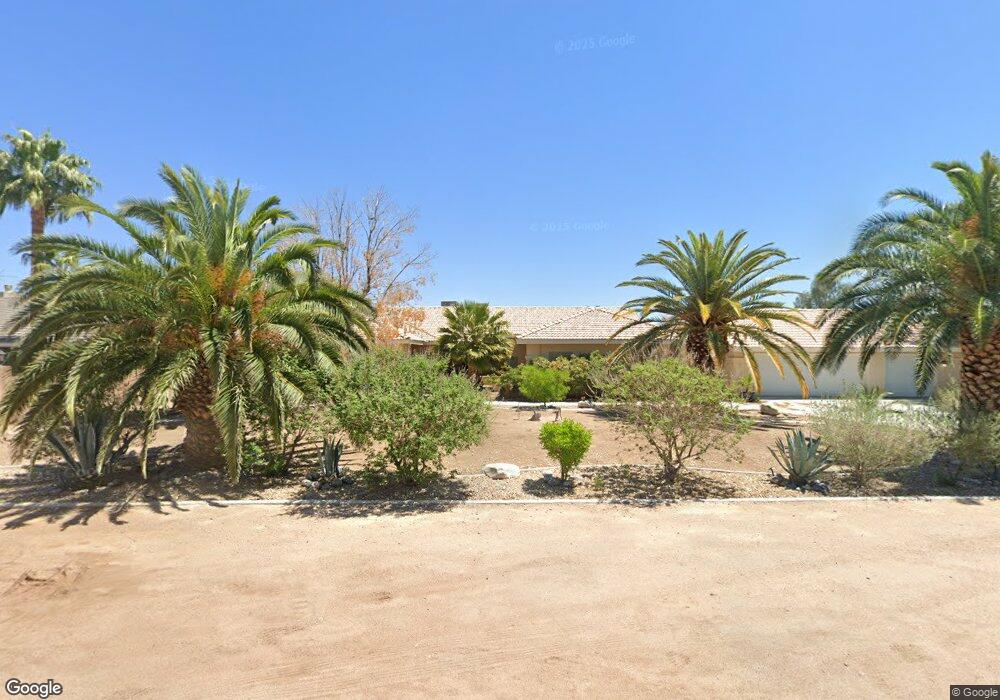
5911 Fannine Way Las Vegas, NV 89130
North Cheyenne NeighborhoodEstimated Value: $759,000 - $813,000
4
Beds
3
Baths
2,944
Sq Ft
$267/Sq Ft
Est. Value
About This Home
This home is located at 5911 Fannine Way, Las Vegas, NV 89130 and is currently estimated at $785,212, approximately $266 per square foot. 5911 Fannine Way is a home located in Clark County with nearby schools including Joseph M Neal Elementary School, Anthony Saville Middle School, and Shadow Ridge High School.
Ownership History
Date
Name
Owned For
Owner Type
Purchase Details
Closed on
Apr 13, 2009
Sold by
Hsbc Bank Usa Na
Bought by
Rodriguez Francisco
Current Estimated Value
Home Financials for this Owner
Home Financials are based on the most recent Mortgage that was taken out on this home.
Original Mortgage
$279,031
Interest Rate
4.8%
Mortgage Type
FHA
Purchase Details
Closed on
Jan 28, 2009
Sold by
Dominguez Miguel and Herrera Rhodesia B
Bought by
Hsbc Bank Usa Na
Purchase Details
Closed on
Jun 22, 2005
Sold by
Fogleman Rex E and Fogleman Lanore C
Bought by
Dominguez Miguel and Herrera Rhodesia B
Home Financials for this Owner
Home Financials are based on the most recent Mortgage that was taken out on this home.
Original Mortgage
$500,000
Interest Rate
6.25%
Mortgage Type
Unknown
Purchase Details
Closed on
Sep 19, 1997
Sold by
Taipale James M and Taipale Robbie M
Bought by
Fogleman Rex E and Fogleman Lanore C
Home Financials for this Owner
Home Financials are based on the most recent Mortgage that was taken out on this home.
Original Mortgage
$191,250
Interest Rate
7.54%
Create a Home Valuation Report for This Property
The Home Valuation Report is an in-depth analysis detailing your home's value as well as a comparison with similar homes in the area
Home Values in the Area
Average Home Value in this Area
Purchase History
| Date | Buyer | Sale Price | Title Company |
|---|---|---|---|
| Rodriguez Francisco | $304,703 | First American Title Paseo V | |
| Hsbc Bank Usa Na | $560,488 | Servicelink San Bernardino | |
| Dominguez Miguel | $625,000 | Ticor Title Of Nevada Inc | |
| Fogleman Rex E | $225,000 | Old Republic Title Company |
Source: Public Records
Mortgage History
| Date | Status | Borrower | Loan Amount |
|---|---|---|---|
| Previous Owner | Rodriguez Francisco | $279,031 | |
| Previous Owner | Dominguez Miguel | $500,000 | |
| Previous Owner | Fogleman Rex E | $191,250 | |
| Closed | Dominguez Miguel | $125,000 |
Source: Public Records
Tax History Compared to Growth
Tax History
| Year | Tax Paid | Tax Assessment Tax Assessment Total Assessment is a certain percentage of the fair market value that is determined by local assessors to be the total taxable value of land and additions on the property. | Land | Improvement |
|---|---|---|---|---|
| 2025 | $4,560 | $202,513 | $87,500 | $115,013 |
| 2024 | $4,223 | $202,513 | $87,500 | $115,013 |
| 2023 | $2,812 | $178,943 | $69,615 | $109,328 |
| 2022 | $3,911 | $155,711 | $55,335 | $100,376 |
| 2021 | $3,621 | $148,518 | $52,500 | $96,018 |
| 2020 | $3,359 | $145,513 | $49,980 | $95,533 |
| 2019 | $3,149 | $142,470 | $48,195 | $94,275 |
| 2018 | $3,004 | $138,988 | $47,250 | $91,738 |
| 2017 | $4,566 | $139,278 | $45,500 | $93,778 |
| 2016 | $2,812 | $128,814 | $35,000 | $93,814 |
| 2015 | $2,807 | $89,102 | $29,750 | $59,352 |
| 2014 | $2,719 | $80,484 | $22,750 | $57,734 |
Source: Public Records
Map
Nearby Homes
- 6204 Muirlands Ct
- 5635 Portage Lake Ct
- 6400 W Ann Rd
- 6245 Hawthorn Woods Ave
- 5917 Kane Holly St
- 5816 Grand Heritage St
- 5912 Grand Heritage St
- 6124 Arwells Corner Ct
- 6099 Ryan Ranch Ave
- 6620 Gray Juniper Ave
- 6805 Silver Chisel Ave
- 5821 Grand Heritage St
- 5817 Grand Heritage St
- 6116 Cottontail Cove St
- 5940 Jasper Ridge St
- 6141 Markleham Ave
- 6900 Cloudy Ridge Ct
- 6112 Rabbit Track St
- 5663 N Balsam St
- 6345 Cinnabar Ridge Ave
- 5901 Fannine Way
- 5925 Fannine Way
- 5937 N Torrey Pines Dr
- 5851 Fannine Way
- 6500 W Tropical Pkwy
- 5900 Fannine Way
- 5993 N Torrey Pines Dr
- 5887 N Torrey Pines Dr
- 5841 Fannine Way
- 6510 W Tropical Pkwy
- 6420 W Tropical Pkwy
- 6420 W Tropical Pw Pkwy
- 5865 N Torrey Pines Dr
- 6430 W Tropical Pkwy
- 6400 W Tropical Pkwy
- 6410 W Tropical Pkwy
- 5831 Fannine Way
- 5840 Fannine Way
- 6513 W Tropical Pkwy
- 5936 N Torrey Pines Dr