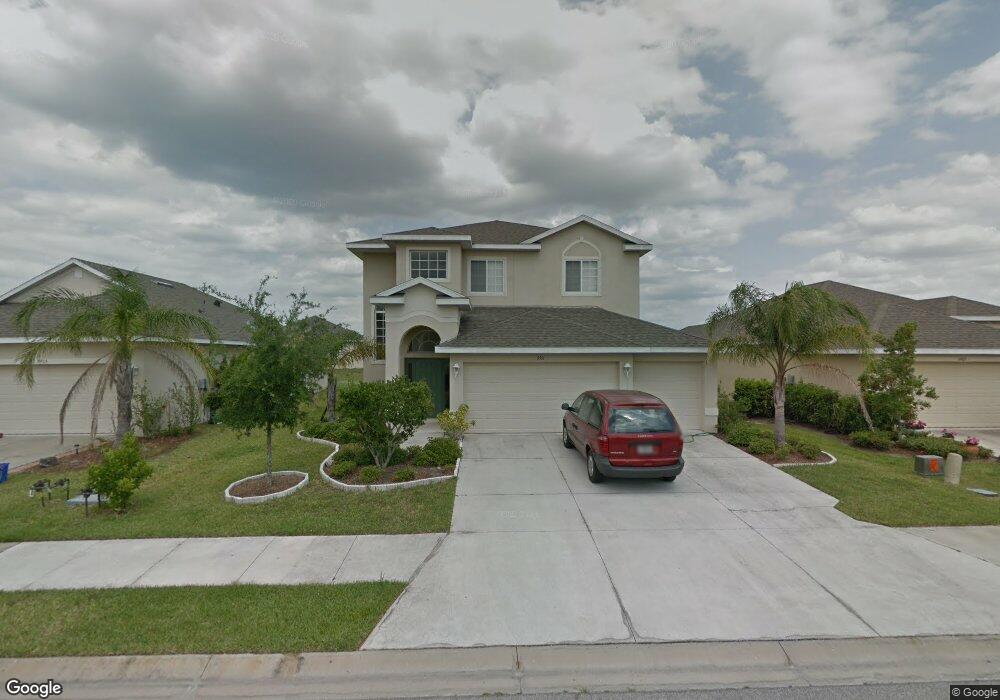
5911 Willows Bridge Loop Ellenton, FL 34222
East Ellenton NeighborhoodEstimated Value: $410,861 - $457,000
4
Beds
3
Baths
2,624
Sq Ft
$163/Sq Ft
Est. Value
About This Home
This home is located at 5911 Willows Bridge Loop, Ellenton, FL 34222 and is currently estimated at $427,465, approximately $162 per square foot. 5911 Willows Bridge Loop is a home located in Manatee County with nearby schools including Virgil Mills Elementary School, Buffalo Creek Middle School, and Palmetto High School.
Ownership History
Date
Name
Owned For
Owner Type
Purchase Details
Closed on
May 12, 2021
Sold by
Progress Residential Exchange Borrower L
Bought by
Progress Residential Borrower 1 Llc
Current Estimated Value
Purchase Details
Closed on
Apr 25, 2019
Sold by
Progress Residential Borrower 7 Llc
Bought by
Progress Res Exchange Borrower Llc
Purchase Details
Closed on
Feb 3, 2015
Sold by
Freo Florida Llc
Bought by
Progress Residential 2015-1 Borrower Llc
Home Financials for this Owner
Home Financials are based on the most recent Mortgage that was taken out on this home.
Original Mortgage
$558,681,000
Interest Rate
3.94%
Mortgage Type
Purchase Money Mortgage
Purchase Details
Closed on
Apr 4, 2014
Sold by
Delmas Alexander Marie Y and Us Bank National Association
Bought by
Freo Florida Llc
Purchase Details
Closed on
Jun 16, 2006
Sold by
U S Home Corp
Bought by
Delmas Alexander Marie Y
Home Financials for this Owner
Home Financials are based on the most recent Mortgage that was taken out on this home.
Original Mortgage
$245,900
Interest Rate
6.49%
Mortgage Type
Purchase Money Mortgage
Create a Home Valuation Report for This Property
The Home Valuation Report is an in-depth analysis detailing your home's value as well as a comparison with similar homes in the area
Home Values in the Area
Average Home Value in this Area
Purchase History
| Date | Buyer | Sale Price | Title Company |
|---|---|---|---|
| Progress Residential Borrower 1 Llc | $100 | Tincher Nathaniel | |
| Progress Res Exchange Borrower Llc | -- | Os National Llc | |
| Progress Residential 2015-1 Borrower Llc | -- | Attorney | |
| Freo Florida Llc | $187,100 | Attorney | |
| Delmas Alexander Marie Y | $327,900 | North American Title Company |
Source: Public Records
Mortgage History
| Date | Status | Borrower | Loan Amount |
|---|---|---|---|
| Previous Owner | Progress Residential 2015-1 Borrower Llc | $558,681,000 | |
| Previous Owner | Delmas Alexander Marie Y | $245,900 |
Source: Public Records
Property History
| Date | Event | Price | List to Sale | Price per Sq Ft |
|---|---|---|---|---|
| 09/10/2025 09/10/25 | Off Market | $2,465 | -- | -- |
| 08/27/2025 08/27/25 | Price Changed | $2,465 | -2.0% | $1 / Sq Ft |
| 08/26/2025 08/26/25 | Price Changed | $2,515 | -1.2% | $1 / Sq Ft |
| 08/25/2025 08/25/25 | Price Changed | $2,545 | -1.9% | $1 / Sq Ft |
| 08/21/2025 08/21/25 | Price Changed | $2,595 | -2.1% | $1 / Sq Ft |
| 08/15/2025 08/15/25 | Price Changed | $2,650 | -1.9% | $1 / Sq Ft |
| 08/10/2025 08/10/25 | Price Changed | $2,700 | -2.0% | $1 / Sq Ft |
| 07/09/2025 07/09/25 | Price Changed | $2,755 | -28.1% | $1 / Sq Ft |
| 07/08/2025 07/08/25 | For Rent | $3,830 | -- | -- |
Tax History
| Year | Tax Paid | Tax Assessment Tax Assessment Total Assessment is a certain percentage of the fair market value that is determined by local assessors to be the total taxable value of land and additions on the property. | Land | Improvement |
|---|---|---|---|---|
| 2025 | $5,874 | $371,241 | $45,900 | $325,341 |
| 2024 | $5,874 | $395,548 | $45,900 | $349,648 |
| 2023 | $5,874 | $420,322 | $45,900 | $374,422 |
| 2022 | $5,298 | $367,574 | $45,000 | $322,574 |
| 2021 | $3,631 | $250,071 | $35,000 | $215,071 |
| 2020 | $3,532 | $230,596 | $35,000 | $195,596 |
| 2019 | $3,676 | $238,270 | $35,000 | $203,270 |
| 2018 | $3,570 | $228,288 | $35,000 | $193,288 |
| 2017 | $3,432 | $230,960 | $0 | $0 |
| 2016 | $3,213 | $210,839 | $0 | $0 |
| 2015 | $1,628 | $199,272 | $0 | $0 |
| 2014 | $1,628 | $137,110 | $0 | $0 |
| 2013 | $1,618 | $135,084 | $0 | $0 |
Source: Public Records
Map
Nearby Homes
- 4811 Halls Mill Crossing
- 5966 Willows Bridge Loop
- 6227 French Creek Ct
- 4509 Halls Mill Crossing
- 5735 Mezzana Run
- 5812 Mezzana Run
- 6222 Laurel Creek Trail
- 5434 Patano Loop
- 5322 Senza Trail
- 5216 Senza Trail
- 5406 Patano Loop
- 5556 Trevesta Place
- 5307 Senza Trail
- 5410 Trevesta Place
- 6507 Rock Bridge Ln
- 6307 Laurel Creek Trail
- 6203 Laurel Creek Trail
- 4247 Day Bridge Place
- 5307 65th Terrace E
- 5640 Trevesta Place
- 5915 Willow Bridge Loop Unit LOOP
- 5915 Willows Bridge Loop
- 5907 Willows Bridge Loop
- 5919 Willow Bridge Loop Unit LOOP
- 5919 Willows Bridge Loop
- 4803 Halls Mill Crossing
- 4807 Halls Mill Crossing
- 4731 Halls Mill Crossing
- 5904 French Creek Ct
- 5923 Willow Bridge Loop Unit LOOP
- 5908 French Creek Ct
- 5910 Willows Bridge Loop
- 5906 Willows Bridge Loop
- 5923 Willows Bridge Loop
- 5914 Willows Bridge Loop
- 5918 Willows Bridge Loop Unit LOOP
- 5846 French Creek Ct
- 5912 French Creek Ct
- 4727 Halls Mill Crossing
- 5918 Willows Bridge Loop
Your Personal Tour Guide
Ask me questions while you tour the home.