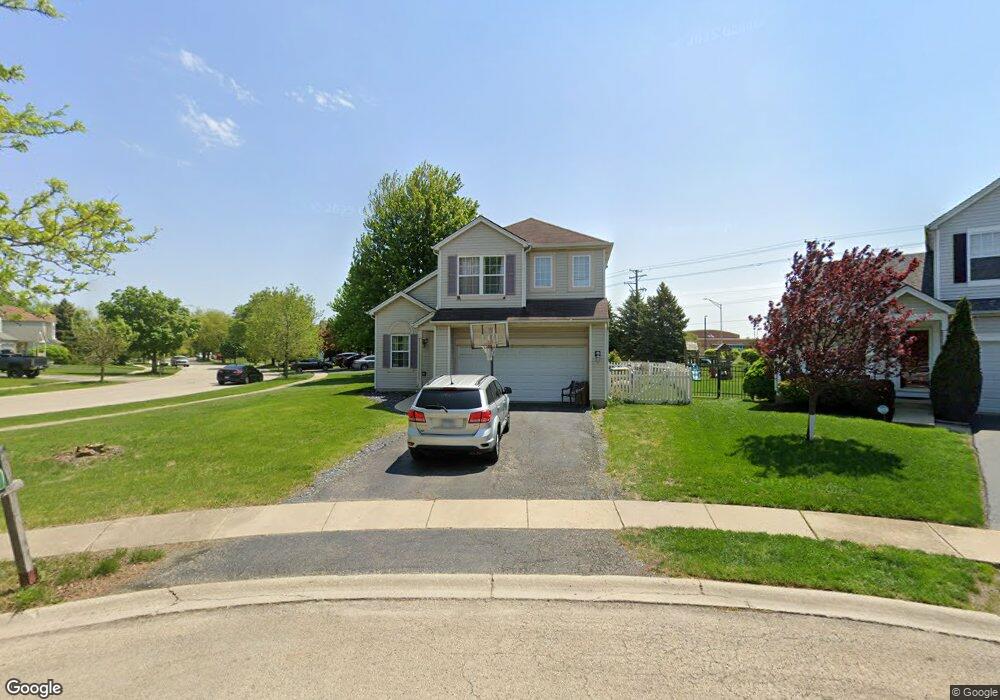
5912 Glass Pointe Cir Unit 1B Plainfield, IL 60586
Fall Creek NeighborhoodEstimated Value: $334,000 - $356,000
3
Beds
2
Baths
1,620
Sq Ft
$212/Sq Ft
Est. Value
About This Home
This home is located at 5912 Glass Pointe Cir Unit 1B, Plainfield, IL 60586 and is currently estimated at $342,885, approximately $211 per square foot. 5912 Glass Pointe Cir Unit 1B is a home located in Will County with nearby schools including Wesmere Elementary School, Drauden Point Middle School, and Plainfield South High School.
Ownership History
Date
Name
Owned For
Owner Type
Purchase Details
Closed on
Dec 23, 2015
Sold by
Gleason Joseph and Gleason Nicole
Bought by
Gleason Joseph M
Current Estimated Value
Home Financials for this Owner
Home Financials are based on the most recent Mortgage that was taken out on this home.
Original Mortgage
$159,000
Outstanding Balance
$126,160
Interest Rate
3.97%
Mortgage Type
New Conventional
Estimated Equity
$216,725
Purchase Details
Closed on
Feb 3, 2004
Sold by
Maier William G and Maier Nicole R
Bought by
Gleason Joseph and Gleason Nicole
Home Financials for this Owner
Home Financials are based on the most recent Mortgage that was taken out on this home.
Original Mortgage
$183,106
Interest Rate
5.74%
Mortgage Type
FHA
Create a Home Valuation Report for This Property
The Home Valuation Report is an in-depth analysis detailing your home's value as well as a comparison with similar homes in the area
Home Values in the Area
Average Home Value in this Area
Purchase History
| Date | Buyer | Sale Price | Title Company |
|---|---|---|---|
| Gleason Joseph M | -- | Attorney | |
| Gleason Joseph | $186,000 | Chicago Title Insurance Co |
Source: Public Records
Mortgage History
| Date | Status | Borrower | Loan Amount |
|---|---|---|---|
| Open | Gleason Joseph M | $159,000 | |
| Closed | Gleason Joseph | $183,106 |
Source: Public Records
Tax History Compared to Growth
Tax History
| Year | Tax Paid | Tax Assessment Tax Assessment Total Assessment is a certain percentage of the fair market value that is determined by local assessors to be the total taxable value of land and additions on the property. | Land | Improvement |
|---|---|---|---|---|
| 2024 | $6,683 | $101,059 | $22,816 | $78,243 |
| 2023 | $6,683 | $91,274 | $20,607 | $70,667 |
| 2022 | $5,966 | $81,976 | $18,508 | $63,468 |
| 2021 | $5,652 | $76,613 | $17,297 | $59,316 |
| 2020 | $5,564 | $74,439 | $16,806 | $57,633 |
| 2019 | $5,366 | $70,928 | $16,013 | $54,915 |
| 2018 | $5,131 | $66,640 | $15,045 | $51,595 |
| 2017 | $4,973 | $63,328 | $14,297 | $49,031 |
| 2016 | $4,867 | $60,399 | $13,636 | $46,763 |
| 2015 | $4,597 | $56,580 | $12,774 | $43,806 |
| 2014 | $4,597 | $54,582 | $12,323 | $42,259 |
| 2013 | $4,597 | $54,582 | $12,323 | $42,259 |
Source: Public Records
Map
Nearby Homes
- 1605 Heritage Pointe Ct
- 0 Theodore St
- 1514 Spring Oaks Dr
- 1407 Prairie Creek Trail
- 1615 Caton Ridge Dr
- 1314 Martin Ct Unit 2
- 1910 Arbor Fields Dr
- 6113 Oldcreek Ln
- 1891 Westmore Grove Dr
- 1504 Lasser Dr
- 2045 Winding Lakes Dr
- 6407 Coyote Ridge Ct
- 6010 Winterhaven Dr
- 1905 Chestnut Grove Dr Unit 1
- 2115 Stafford Ct Unit 3
- 1120 Trillium Ln
- 1603 Valley Ridge Dr
- 1313 Roth Dr
- 1418 Fitzer Dr
- 2015 Brunswick Dr
- 5914 Glass Pointe Cir
- 5910 Emerald Pointe Dr
- 5908 Emerald Pointe Dr
- 5916 Glass Pointe Cir
- 5911 Emerald Pointe Dr
- 5913 Emerald Pointe Dr
- 5906 Emerald Pointe Dr
- 5918 Glass Pointe Cir
- 5924 Glass Pointe Cir
- 5907 Emerald Pointe Dr
- 5915 Emerald Pointe Dr
- 5920 Glass Pointe Cir
- 5922 Glass Pointe Cir
- 5904 Emerald Pointe Dr
- 5905 Emerald Pointe Dr
- 5917 Emerald Pointe Dr
- 1603 Heritage Pointe Ct
- 5902 Emerald Pointe Dr
- 1602 Heritage Pointe Ct
- 5926 Emerald Pointe Dr