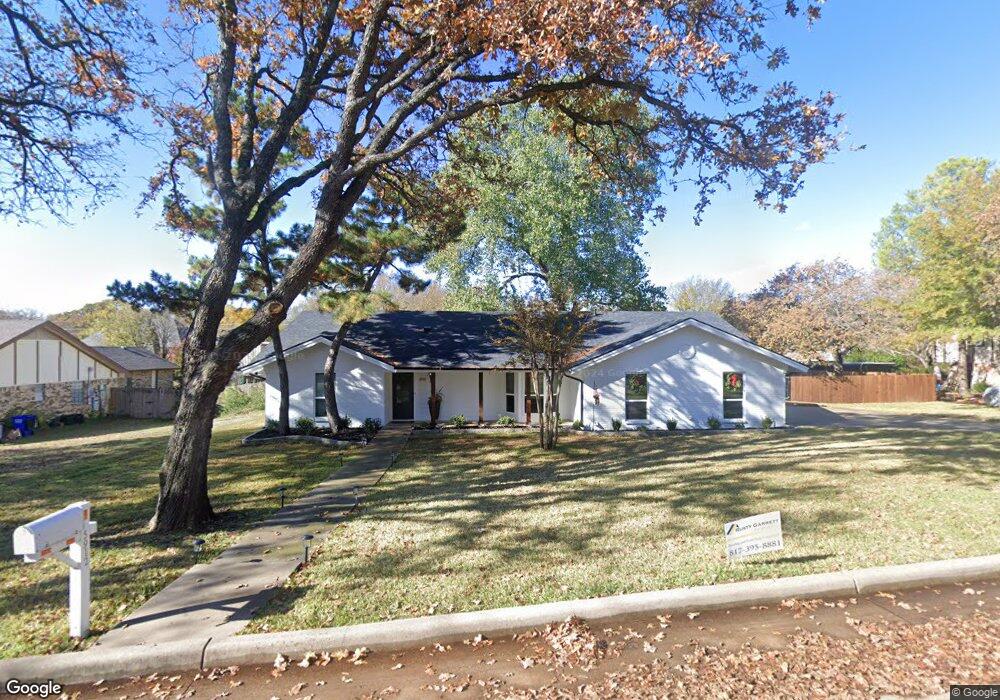
5912 Quails Path Colleyville, TX 76034
Estimated Value: $533,000 - $621,000
3
Beds
2
Baths
1,682
Sq Ft
$346/Sq Ft
Est. Value
About This Home
This home is located at 5912 Quails Path, Colleyville, TX 76034 and is currently estimated at $582,503, approximately $346 per square foot. 5912 Quails Path is a home located in Tarrant County with nearby schools including Colleyville Elementary School, Colleyville Middle School, and Grapevine High School.
Ownership History
Date
Name
Owned For
Owner Type
Purchase Details
Closed on
Sep 28, 2017
Sold by
Kieweg Irene
Bought by
Kieweg Kenneth J
Current Estimated Value
Home Financials for this Owner
Home Financials are based on the most recent Mortgage that was taken out on this home.
Original Mortgage
$231,013
Outstanding Balance
$193,322
Interest Rate
3.89%
Mortgage Type
New Conventional
Estimated Equity
$389,181
Purchase Details
Closed on
Oct 8, 2014
Sold by
Contos George James and Contos Carolyn Ruth
Bought by
Kieweg Kenneth J and Kieweg Irene
Home Financials for this Owner
Home Financials are based on the most recent Mortgage that was taken out on this home.
Original Mortgage
$34,000
Interest Rate
4.13%
Mortgage Type
Purchase Money Mortgage
Purchase Details
Closed on
Jan 27, 2012
Sold by
Contos Carolyn Ruth
Bought by
Contos George James and Contos Carolyn Ruth
Purchase Details
Closed on
Jul 22, 1994
Sold by
Contos George J
Bought by
Contos Carolyn R
Create a Home Valuation Report for This Property
The Home Valuation Report is an in-depth analysis detailing your home's value as well as a comparison with similar homes in the area
Home Values in the Area
Average Home Value in this Area
Purchase History
| Date | Buyer | Sale Price | Title Company |
|---|---|---|---|
| Kieweg Kenneth J | -- | None Available | |
| Kieweg Kenneth J | -- | Old Republic Title | |
| Contos George James | -- | None Available | |
| Contos Carolyn R | -- | -- |
Source: Public Records
Mortgage History
| Date | Status | Borrower | Loan Amount |
|---|---|---|---|
| Open | Kieweg Kenneth J | $231,013 | |
| Closed | Kieweg Kenneth J | $34,000 |
Source: Public Records
Tax History Compared to Growth
Tax History
| Year | Tax Paid | Tax Assessment Tax Assessment Total Assessment is a certain percentage of the fair market value that is determined by local assessors to be the total taxable value of land and additions on the property. | Land | Improvement |
|---|---|---|---|---|
| 2025 | $1,744 | $507,746 | $250,870 | $256,876 |
| 2024 | $1,744 | $507,746 | $250,870 | $256,876 |
| 2023 | $6,570 | $508,712 | $250,870 | $257,842 |
| 2022 | $6,993 | $449,062 | $250,870 | $198,192 |
| 2021 | $7,069 | $321,906 | $151,740 | $170,166 |
| 2020 | $7,098 | $345,730 | $151,740 | $193,990 |
| 2019 | $6,714 | $290,406 | $151,740 | $138,666 |
| 2018 | $1,638 | $275,524 | $151,740 | $123,784 |
| 2017 | $5,992 | $294,839 | $151,740 | $143,099 |
| 2016 | $5,447 | $293,120 | $148,740 | $144,380 |
| 2015 | $4,857 | $209,600 | $50,000 | $159,600 |
| 2014 | $4,857 | $209,600 | $50,000 | $159,600 |
Source: Public Records
Map
Nearby Homes
- 6004 Hunter Ct
- 5800 Hunter Trail
- 613 Colts Neck Ct
- 200 Valley View Dr N
- 5803 Chalford Common
- 203 Polo Trail
- 5609 Oak Top Dr
- 803 Marie Dr
- 5902 Preston Way
- 5903 Crescent Ln
- 5913 Preston Way
- 6112 Emmas Ct
- 5918 Crescent Ln
- 6401 Westcoat Dr
- 6108 Westcoat Dr
- 5509 Texas Trail
- 6776 St Moritz Pkwy
- 5804 Sterling Dr
- 203 Oak Valley Dr
- 621 Trails End Ct
- 6000 Quails Path
- 5908 Quails Path
- 5913 Quality Hill Rd
- 5913 Quails Path
- 6001 Quality Hill Rd
- 5909 Quality Hill St
- 6001 Quails Path
- 6004 Quails Path
- 5909 Quails Path
- 6005 Quality Hill Rd
- 5904 Quails Path
- 5912 Quality Hill Rd
- 5905 Quails Path
- 6005 Quails Path
- 5916 Chestnut Bend
- 5908 Quality Hill Rd
- 6000 Chestnut Bend
- 5912 Chestnut Bend
- 5901 Quality Hill Rd
- 6000 Quality Hill Rd