Estimated Value: $421,760 - $525,000
2
Beds
2
Baths
2,048
Sq Ft
$220/Sq Ft
Est. Value
About This Home
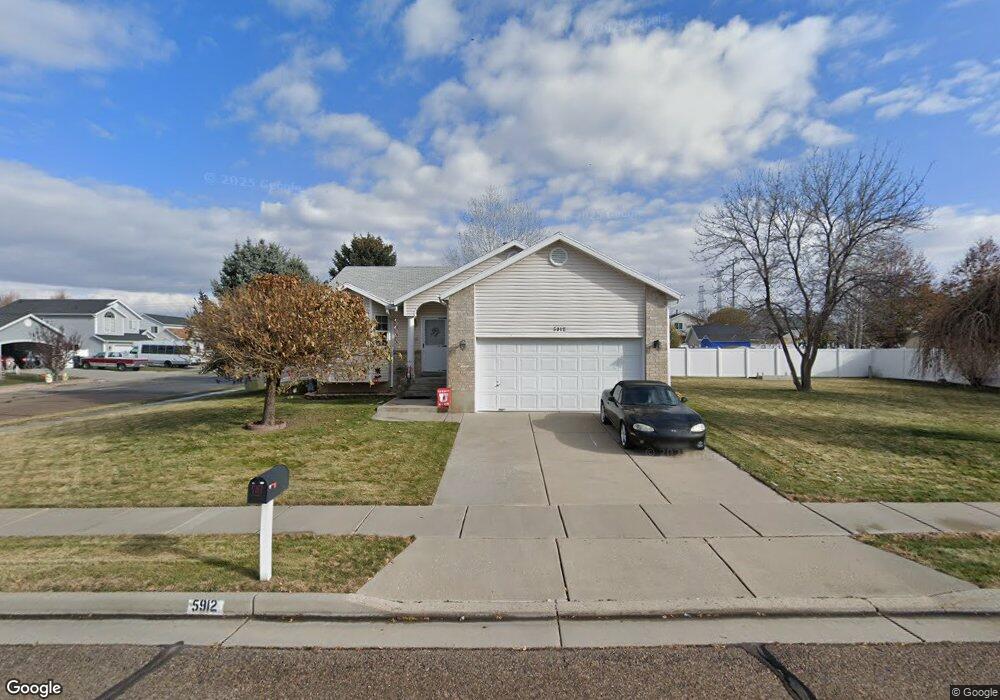
This home is located at 5912 S 3375 W, Roy, UT 84067 and is currently estimated at $450,690, approximately $220 per square foot. 5912 S 3375 W is a home located in Weber County with nearby schools including Roy Elementary School, Roy Junior High School, and Roy High School.
Ownership History
Date
Name
Owned For
Owner Type
Purchase Details
Closed on
Apr 25, 2002
Sold by
Carlson Dean G
Bought by
Carlson Dean G
Current Estimated Value
Home Financials for this Owner
Home Financials are based on the most recent Mortgage that was taken out on this home.
Original Mortgage
$135,098
Outstanding Balance
$57,082
Interest Rate
7.08%
Mortgage Type
FHA
Estimated Equity
$393,608
Purchase Details
Closed on
Sep 27, 2000
Sold by
Archuleta Barbara M
Bought by
Carlson Dean G
Home Financials for this Owner
Home Financials are based on the most recent Mortgage that was taken out on this home.
Original Mortgage
$133,102
Interest Rate
7.98%
Purchase Details
Closed on
Jul 16, 1997
Sold by
Nilson & Company Inc
Bought by
Archuleta Barbara M
Home Financials for this Owner
Home Financials are based on the most recent Mortgage that was taken out on this home.
Original Mortgage
$93,300
Interest Rate
7.83%
Create a Home Valuation Report for This Property
The Home Valuation Report is an in-depth analysis detailing your home's value as well as a comparison with similar homes in the area
Home Values in the Area
Average Home Value in this Area
Purchase History
| Date | Buyer | Sale Price | Title Company |
|---|---|---|---|
| Carlson Dean G | -- | Equity Title | |
| Carlson Dean G | -- | Associated Title | |
| Archuleta Barbara M | -- | Bonneville Title |
Source: Public Records
Mortgage History
| Date | Status | Borrower | Loan Amount |
|---|---|---|---|
| Open | Carlson Dean G | $135,098 | |
| Closed | Carlson Dean G | $133,102 | |
| Previous Owner | Archuleta Barbara M | $93,300 |
Source: Public Records
Tax History
| Year | Tax Paid | Tax Assessment Tax Assessment Total Assessment is a certain percentage of the fair market value that is determined by local assessors to be the total taxable value of land and additions on the property. | Land | Improvement |
|---|---|---|---|---|
| 2025 | $2,665 | $423,292 | $130,000 | $293,292 |
| 2024 | $2,600 | $228,799 | $71,423 | $157,376 |
| 2023 | $2,593 | $229,350 | $71,424 | $157,926 |
| 2022 | $2,672 | $243,650 | $60,503 | $183,147 |
| 2021 | $2,125 | $317,000 | $84,997 | $232,003 |
| 2020 | $2,000 | $274,000 | $84,997 | $189,003 |
| 2019 | $1,918 | $247,000 | $49,948 | $197,052 |
| 2018 | $1,877 | $228,000 | $46,959 | $181,041 |
| 2017 | $1,721 | $195,000 | $46,015 | $148,985 |
| 2016 | $1,670 | $101,762 | $24,389 | $77,373 |
| 2015 | $1,493 | $92,517 | $21,700 | $70,817 |
| 2014 | $1,418 | $86,363 | $21,700 | $64,663 |
Source: Public Records
Map
Nearby Homes
- 5791 S 3260 W
- 5854 S 3500 W
- 5999 S 3200 W
- 2593 N 2000 W
- 3176 W 5625 S
- 2606 N 2125 W
- 2606 N 2125 W Unit 149
- 2602 N 2125 W
- 2602 N 2125 W Unit 150
- 2596 N 2125 W Unit 151
- 2596 N 2125 W
- 2186 W 2615 N
- 2186 W 2615 N Unit 139
- 3009 W 6000 S
- 2566 N 2125 W
- 2208 W 2615 N
- 2208 W 2615 N Unit 141
- 2216 W 2615 N Unit 142
- 5529 S 3200 W
- 2963 W 5750 S
Your Personal Tour Guide
Ask me questions while you tour the home.