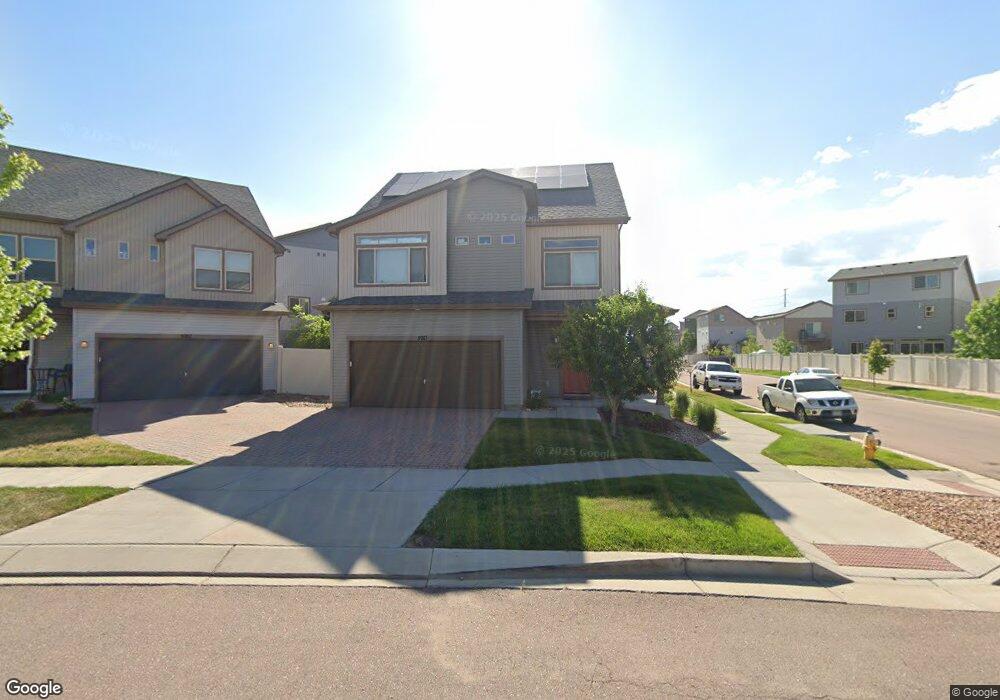
5913 John Muir Trail Colorado Springs, CO 80927
Banning Lewis Ranch NeighborhoodEstimated Value: $442,000 - $454,000
3
Beds
3
Baths
1,932
Sq Ft
$232/Sq Ft
Est. Value
About This Home
This home is located at 5913 John Muir Trail, Colorado Springs, CO 80927 and is currently estimated at $447,318, approximately $231 per square foot. 5913 John Muir Trail is a home with nearby schools including Inspiration View Elementary School, Skyview Middle School, and Vista Ridge High School.
Ownership History
Date
Name
Owned For
Owner Type
Purchase Details
Closed on
Mar 5, 2021
Sold by
Howery Patrick and Howery Linda
Bought by
Bradbury Trenton and Bradbury Jake
Current Estimated Value
Home Financials for this Owner
Home Financials are based on the most recent Mortgage that was taken out on this home.
Original Mortgage
$363,298
Outstanding Balance
$325,671
Interest Rate
2.7%
Mortgage Type
FHA
Estimated Equity
$121,647
Purchase Details
Closed on
Jan 15, 2020
Sold by
Pajas Raymond
Bought by
Howery Patrick and Howery Linda
Home Financials for this Owner
Home Financials are based on the most recent Mortgage that was taken out on this home.
Original Mortgage
$248,000
Interest Rate
3.12%
Mortgage Type
New Conventional
Purchase Details
Closed on
Apr 26, 2017
Sold by
Oakwood Homes Llc
Bought by
Pajas Raymond
Home Financials for this Owner
Home Financials are based on the most recent Mortgage that was taken out on this home.
Original Mortgage
$278,957
Interest Rate
4.23%
Mortgage Type
VA
Create a Home Valuation Report for This Property
The Home Valuation Report is an in-depth analysis detailing your home's value as well as a comparison with similar homes in the area
Home Values in the Area
Average Home Value in this Area
Purchase History
| Date | Buyer | Sale Price | Title Company |
|---|---|---|---|
| Bradbury Trenton | $370,000 | First American Title | |
| Howery Patrick | $310,000 | Empire Title Co Springs Llc | |
| Pajas Raymond | $273,086 | None Available |
Source: Public Records
Mortgage History
| Date | Status | Borrower | Loan Amount |
|---|---|---|---|
| Open | Bradbury Trenton | $363,298 | |
| Previous Owner | Howery Patrick | $248,000 | |
| Previous Owner | Pajas Raymond | $278,957 |
Source: Public Records
Tax History Compared to Growth
Tax History
| Year | Tax Paid | Tax Assessment Tax Assessment Total Assessment is a certain percentage of the fair market value that is determined by local assessors to be the total taxable value of land and additions on the property. | Land | Improvement |
|---|---|---|---|---|
| 2025 | $3,125 | $31,260 | -- | -- |
| 2024 | $3,065 | $31,650 | $5,110 | $26,540 |
| 2023 | $3,065 | $31,650 | $5,110 | $26,540 |
| 2022 | $2,490 | $22,350 | $4,450 | $17,900 |
| 2021 | $2,547 | $22,990 | $4,580 | $18,410 |
| 2020 | $2,391 | $21,440 | $3,050 | $18,390 |
| 2019 | $2,700 | $21,440 | $3,050 | $18,390 |
| 2018 | $2,445 | $19,300 | $2,510 | $16,790 |
| 2017 | $639 | $19,300 | $2,510 | $16,790 |
| 2016 | $38 | $310 | $310 | $0 |
Source: Public Records
Map
Nearby Homes
- 6155 Mineral Belt Dr
- 6712 Golden Briar Ln
- 6742 Golden Briar Ln
- 6652 Golden Briar Ln
- 6747 Golden Briar Ln
- 6669 John Muir Trail
- 6646 Golden Briar Ln
- 6670 John Muir Trail
- 6407 Armdale Heights
- 6689 Shadow Star Dr
- 6765 Windbrook Ct
- 6362 Lythmore Grove
- 6347 Melvick Point
- 6838 Backcountry Loop
- 6263 Armdale Heights
- 6260 Melvick Point
- 6272 Lochside View
- 8674 Tranquil Knoll Ln
- 6234 Lythmore Grove
- 6242 Lythmore Grove
- 6123 Mineral Belt Dr
- 5927 John Muir Trail
- 6131 Mineral Belt Dr
- 6514 Shadow Star Dr
- 6147 Mineral Belt Dr
- 6123 John Muir Trail
- 6139 Mineral Belt Dr
- 6151 John Muir Trail
- 6522 Shadow Star Dr
- 6165 John Muir Trail
- 5928 John Muir Trail
- 6513 Shadow Star Dr
- 6521 Thicket Pass Ln
- 6137 John Muir Trail
- 6163 Mineral Belt Dr
- 6530 Shadow Star Dr
- 6538 Shadow Star Dr
- 6109 John Muir Trail
- 6207 John Muir Trail
- 5970 John Muir Trail