Estimated Value: $324,000 - $385,000
4
Beds
1
Bath
1,450
Sq Ft
$244/Sq Ft
Est. Value
About This Home
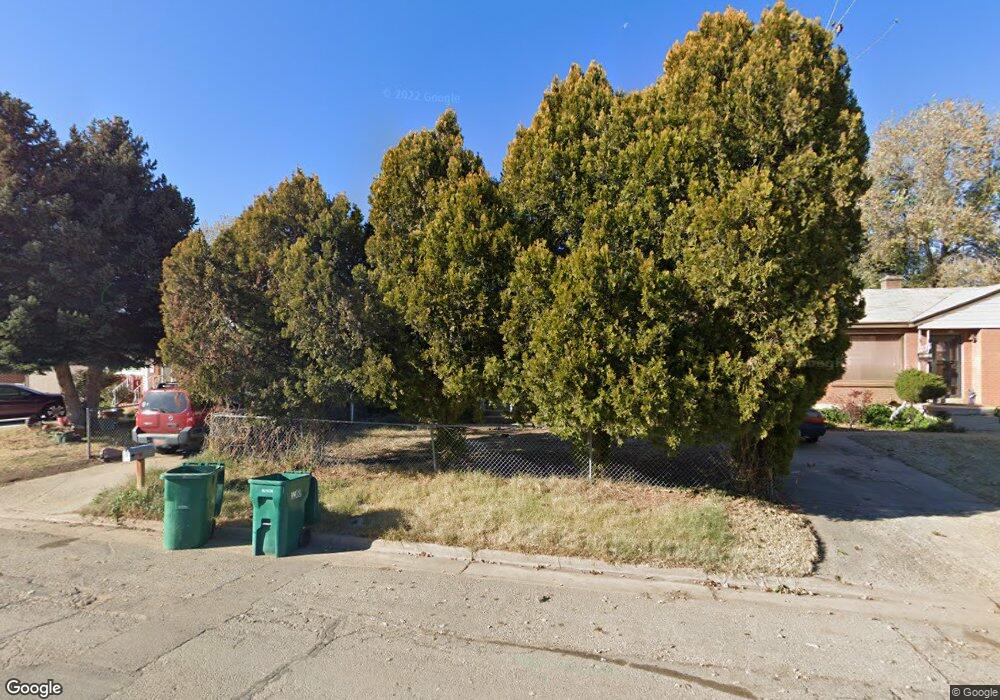
This home is located at 5913 S 2600 W, Roy, UT 84067 and is currently estimated at $354,494, approximately $244 per square foot. 5913 S 2600 W is a home located in Weber County with nearby schools including Roy Elementary School, Roy Junior High School, and Roy High School.
Ownership History
Date
Name
Owned For
Owner Type
Purchase Details
Closed on
Sep 5, 2017
Sold by
Wybrow Amanda L
Bought by
Smith Guillermo Jose
Current Estimated Value
Home Financials for this Owner
Home Financials are based on the most recent Mortgage that was taken out on this home.
Original Mortgage
$163,975
Outstanding Balance
$141,173
Interest Rate
5.12%
Mortgage Type
FHA
Estimated Equity
$213,321
Purchase Details
Closed on
Jan 29, 2015
Sold by
Malan Julie M
Bought by
Bank Of Utah and Meyer Ritchie W
Purchase Details
Closed on
Nov 8, 2013
Sold by
Malan Julie M and Malan Julia M
Bought by
Malan Julie M
Home Financials for this Owner
Home Financials are based on the most recent Mortgage that was taken out on this home.
Original Mortgage
$177,000
Interest Rate
2.54%
Mortgage Type
Reverse Mortgage Home Equity Conversion Mortgage
Create a Home Valuation Report for This Property
The Home Valuation Report is an in-depth analysis detailing your home's value as well as a comparison with similar homes in the area
Home Values in the Area
Average Home Value in this Area
Purchase History
| Date | Buyer | Sale Price | Title Company |
|---|---|---|---|
| Smith Guillermo Jose | -- | Mountain America Title | |
| Bank Of Utah | $97,000 | None Available | |
| Malan Julie M | -- | Title Source Inc |
Source: Public Records
Mortgage History
| Date | Status | Borrower | Loan Amount |
|---|---|---|---|
| Open | Smith Guillermo Jose | $163,975 | |
| Previous Owner | Malan Julie M | $177,000 |
Source: Public Records
Tax History Compared to Growth
Tax History
| Year | Tax Paid | Tax Assessment Tax Assessment Total Assessment is a certain percentage of the fair market value that is determined by local assessors to be the total taxable value of land and additions on the property. | Land | Improvement |
|---|---|---|---|---|
| 2025 | $1,901 | $288,635 | $95,215 | $193,420 |
| 2024 | $1,840 | $154,548 | $52,376 | $102,172 |
| 2023 | $1,779 | $149,599 | $53,638 | $95,961 |
| 2022 | $2,043 | $180,950 | $49,858 | $131,092 |
| 2021 | $1,550 | $221,998 | $58,268 | $163,730 |
| 2020 | $1,452 | $191,000 | $58,268 | $132,732 |
| 2019 | $1,498 | $187,000 | $34,683 | $152,317 |
| 2018 | $1,322 | $152,999 | $30,008 | $122,991 |
| 2017 | $1,148 | $122,000 | $30,008 | $91,992 |
| 2016 | $1,118 | $63,862 | $17,228 | $46,634 |
| 2015 | $830 | $58,748 | $19,813 | $38,935 |
| 2014 | $746 | $52,233 | $14,630 | $37,603 |
Source: Public Records
Map
Nearby Homes
- 2587 W 5750 S
- 5810 S 2550 W
- 2672 W 5750 S
- 2571 W 5725 S
- 2829 W 5925 S
- 2646 W 5625 S Unit M-2646
- 2907 W 5775 S
- 3027 W 2600 N
- 3033 W 2600 N
- 3068 W 2600 N
- 484 W 2650 N
- 480 W 2650 N
- 2635 N 500 W Unit 45
- 2612 N 525 W
- 2486 N 690 W
- 2593 N 500 W Unit 56
- 2537 N 1220 W
- 2995 W 5750 S
- 3009 W 6000 S
- 428 W 2650 N