5914 Annunciation St Houston, TX 77016
East Little York NeighborhoodEstimated Value: $164,000 - $216,000
3
Beds
2
Baths
1,196
Sq Ft
$152/Sq Ft
Est. Value
About This Home
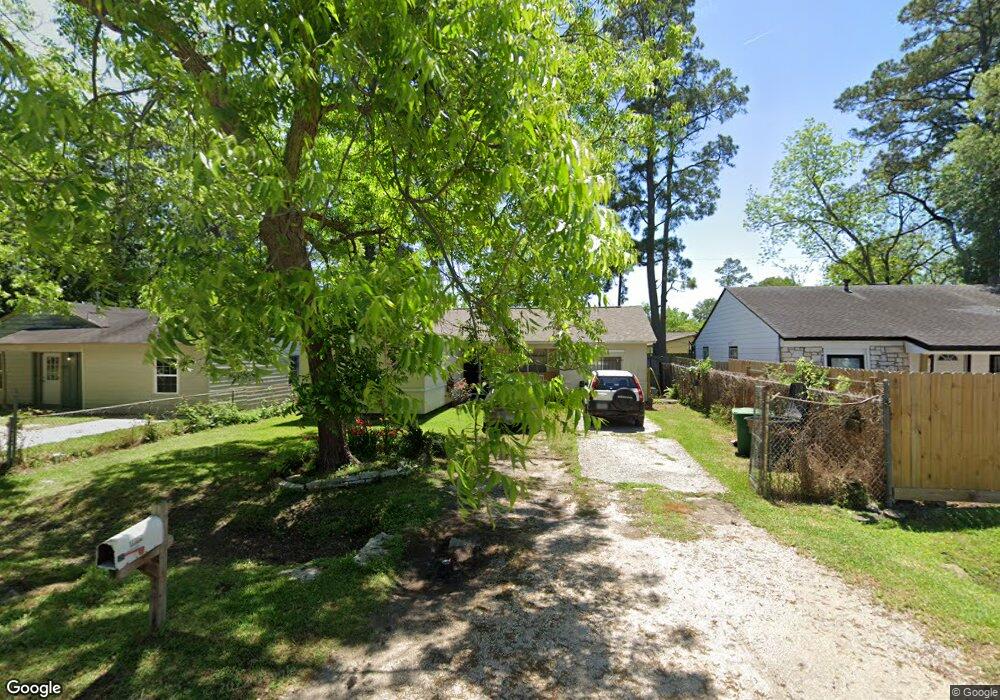
This home is located at 5914 Annunciation St, Houston, TX 77016 and is currently estimated at $181,805, approximately $152 per square foot. 5914 Annunciation St is a home located in Harris County with nearby schools including Thurgood Marshall Elementary, Forest Brook Middle, and North Forest High School.
Ownership History
Date
Name
Owned For
Owner Type
Purchase Details
Closed on
Dec 22, 1999
Sold by
Homebuyers Inc
Bought by
Alvarez Jose M and Alvarez Irelda E
Current Estimated Value
Home Financials for this Owner
Home Financials are based on the most recent Mortgage that was taken out on this home.
Original Mortgage
$39,600
Outstanding Balance
$12,256
Interest Rate
7.71%
Mortgage Type
Seller Take Back
Estimated Equity
$169,549
Purchase Details
Closed on
Sep 23, 1999
Sold by
The Chase Manhattan Bank
Bought by
Home Buyers Inc
Home Financials for this Owner
Home Financials are based on the most recent Mortgage that was taken out on this home.
Original Mortgage
$21,500
Interest Rate
7.85%
Purchase Details
Closed on
Aug 3, 1999
Sold by
Torres Carlos Antonio and Torres Maria Del Pilar
Bought by
Chase Manhattan Bank
Home Financials for this Owner
Home Financials are based on the most recent Mortgage that was taken out on this home.
Original Mortgage
$21,500
Interest Rate
7.85%
Create a Home Valuation Report for This Property
The Home Valuation Report is an in-depth analysis detailing your home's value as well as a comparison with similar homes in the area
Home Values in the Area
Average Home Value in this Area
Purchase History
| Date | Buyer | Sale Price | Title Company |
|---|---|---|---|
| Alvarez Jose M | -- | American Title | |
| Home Buyers Inc | -- | Heritage Title Co | |
| Chase Manhattan Bank | $25,500 | -- |
Source: Public Records
Mortgage History
| Date | Status | Borrower | Loan Amount |
|---|---|---|---|
| Open | Alvarez Jose M | $39,600 | |
| Previous Owner | Home Buyers Inc | $21,500 | |
| Closed | Alvarez Jose M | $2,200 |
Source: Public Records
Tax History Compared to Growth
Tax History
| Year | Tax Paid | Tax Assessment Tax Assessment Total Assessment is a certain percentage of the fair market value that is determined by local assessors to be the total taxable value of land and additions on the property. | Land | Improvement |
|---|---|---|---|---|
| 2025 | $645 | $112,992 | $47,032 | $65,960 |
| 2024 | $645 | $106,215 | $38,923 | $67,292 |
| 2023 | $645 | $101,223 | $38,923 | $62,300 |
| 2022 | $1,196 | $75,337 | $25,949 | $49,388 |
| 2021 | $1,151 | $75,337 | $25,949 | $49,388 |
| 2020 | $1,087 | $60,844 | $14,596 | $46,248 |
| 2019 | $1,033 | $56,486 | $14,596 | $41,890 |
| 2018 | $452 | $37,100 | $12,326 | $24,774 |
| 2017 | $938 | $37,100 | $12,326 | $24,774 |
| 2016 | $870 | $37,100 | $12,326 | $24,774 |
| 2015 | $406 | $37,100 | $12,326 | $24,774 |
| 2014 | $406 | $28,426 | $12,326 | $16,100 |
Source: Public Records
Map
Nearby Homes
- 5613 Annunciation St
- 6130 Hartwick Rd
- 6210 Annunciation St
- 5833 Mohawk St
- 5815 Mohawk St
- 6310 Hartwick Rd
- 11110 Homestead Rd
- 5714 Justin St
- 0 Hopper Rd Unit 35613143
- 6319 Annunciation St
- 6319 Guadalupe St
- 10403 Meadow Saffron Dr
- 10711 Red Orchid Dr
- 6406 Guadalupe St
- 10507 Vinca Minor Ln
- 6319 Hopper Rd
- 11610 Danford Ln
- 6410 Hartwick Rd
- 6302 Hanley Ln
- 0 Cedar Hill Ln Unit 45497108
- 5918 Annunciation St
- 5910 Annunciation St
- 5922 Annunciation St
- 5906 Annunciation St
- 5911 Guadalupe St
- 5919 Guadalupe St
- 5926 Annunciation St
- 5900 Annunciation St
- 5907 Guadalupe St
- 5923 Guadalupe St
- 5915 Annunciation St
- 5919 Annunciation St
- 5911 Annunciation St
- 5927 Guadalupe St
- 5930 Annunciation St
- 5923 Annunciation St
- 5907 Annunciation St
- 5927 Annunciation St
- 5903 Annunciation St
- 5835 Guadalupe St