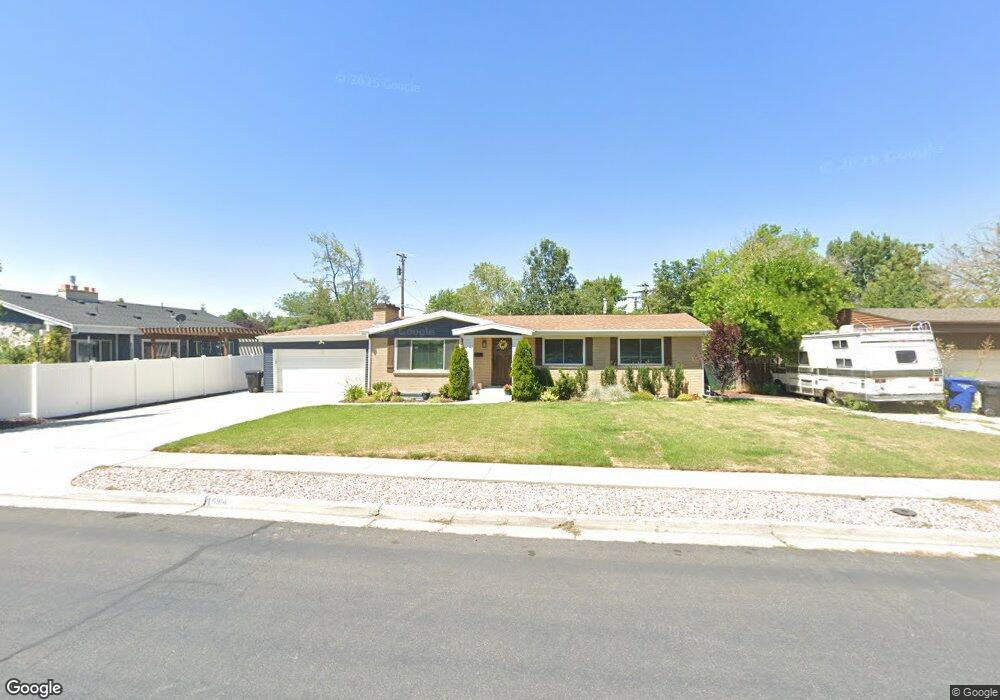
5914 Fontaine Bleu Dr Salt Lake City, UT 84121
Estimated Value: $699,000 - $808,460
5
Beds
3
Baths
1,288
Sq Ft
$586/Sq Ft
Est. Value
About This Home
This home is located at 5914 Fontaine Bleu Dr, Salt Lake City, UT 84121 and is currently estimated at $754,615, approximately $585 per square foot. 5914 Fontaine Bleu Dr is a home located in Salt Lake County with nearby schools including Woodstock Elementary School, Bonneville Junior High School, and Cottonwood High School.
Ownership History
Date
Name
Owned For
Owner Type
Purchase Details
Closed on
Apr 15, 2021
Sold by
Thornton Margaret
Bought by
Thornton Margaret M and Margaret M Thornton Revocable
Current Estimated Value
Purchase Details
Closed on
Apr 13, 2021
Sold by
Star Team Properties Llc
Bought by
Thornton Margaret
Purchase Details
Closed on
Nov 11, 2020
Sold by
Cutrubus Krystal P and Cutrubus Katrina A
Bought by
Star Team Properties Llc
Purchase Details
Closed on
Aug 22, 2012
Sold by
Mcneill Michelle and Hegemann Teri
Bought by
Cutrubus Krystal P and Cutrubus Katrina A
Purchase Details
Closed on
Nov 17, 2008
Sold by
Adams Dennis G
Bought by
Adams Dennis G
Purchase Details
Closed on
Nov 4, 2008
Sold by
Adams Dennis G
Bought by
The Dennis G Adams Trust
Create a Home Valuation Report for This Property
The Home Valuation Report is an in-depth analysis detailing your home's value as well as a comparison with similar homes in the area
Home Values in the Area
Average Home Value in this Area
Purchase History
| Date | Buyer | Sale Price | Title Company |
|---|---|---|---|
| Thornton Margaret M | -- | Accommodation | |
| Thornton Margaret | -- | Metro National Title | |
| Star Team Properties Llc | -- | Real Advantage Ttl Ins Agcy | |
| Cutrubus Krystal P | -- | Us Title | |
| Adams Dennis G | -- | None Available | |
| The Dennis G Adams Trust | -- | None Available |
Source: Public Records
Tax History Compared to Growth
Tax History
| Year | Tax Paid | Tax Assessment Tax Assessment Total Assessment is a certain percentage of the fair market value that is determined by local assessors to be the total taxable value of land and additions on the property. | Land | Improvement |
|---|---|---|---|---|
| 2025 | $3,586 | $716,100 | $303,500 | $412,600 |
| 2024 | $3,586 | $655,400 | $294,100 | $361,300 |
| 2023 | $3,693 | $649,000 | $233,400 | $415,600 |
| 2022 | $3,628 | $638,600 | $228,800 | $409,800 |
| 2021 | $2,938 | $457,500 | $176,000 | $281,500 |
| 2020 | $2,711 | $401,800 | $173,000 | $228,800 |
| 2019 | $2,679 | $386,100 | $163,900 | $222,200 |
| 2018 | $2,542 | $354,000 | $163,900 | $190,100 |
| 2017 | $2,268 | $354,400 | $163,900 | $190,500 |
| 2016 | $2,059 | $321,900 | $163,900 | $158,000 |
| 2015 | $2,056 | $299,400 | $172,100 | $127,300 |
| 2014 | $1,937 | $277,500 | $163,900 | $113,600 |
Source: Public Records
Map
Nearby Homes
- 5841 S Fontaine Bleu Cir
- 1694 E Cannes Way
- 1557 E Waterbury Dr Unit A
- 5780 S Minden Dr
- 5820 S Waterbury Way Unit H
- 5809 S Waterbury Dr Unit D
- 1963 E Charleston Ln
- 1460 E Vintry Cir
- 1574 E Winward Dr
- 5946 S Highland Dr
- 1958 E Cecelia Cir
- 1876 Jeremy Ct
- 1261 Sandra Cir
- 6294 S Lombardy Dr
- 1369 E Farm Hill Dr
- 1360 E Old Maple Ct
- 1364 Old Maple Ct
- 5588 S Farm Hill Dr
- 6385 S 1765 E
- 6414 S 1680 E
- 5914 S Fontaine Bleu Dr
- 5926 Fontaine Bleu Dr
- 5900 Fontaine Bleu Dr
- 5926 S Fontaine Bleu Dr
- 1629 Monaco Ave
- 1632 Deauville Ave
- 1619 Monaco Ave
- 5929 Fontaine Bleu Dr
- 1620 E Deauville Ave
- 1620 Deauville Ave
- 5929 S Fontaine Bleu Dr
- 5895 S Fontaine Bleu Cir
- 1661 Denarles Cir
- 5948 Fontaine Bleu Dr
- 5895 Fontaine Bleu Dr
- 1610 E Deauville Ave
- 1628 Monaco Ave
- 1628 E Monaco Ave
- 1607 Monaco Ave
- 1668 Denarles Cir