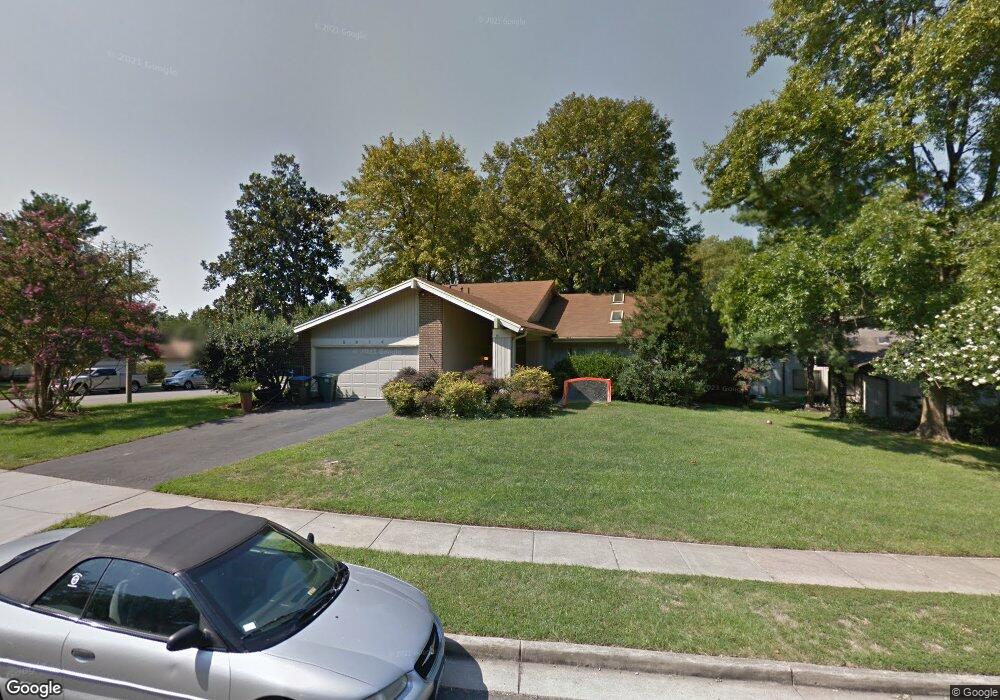
5914 Lovejoy Ct Springfield, VA 22152
Estimated Value: $703,000 - $751,682
3
Beds
3
Baths
1,296
Sq Ft
$564/Sq Ft
Est. Value
About This Home
This home is located at 5914 Lovejoy Ct, Springfield, VA 22152 and is currently estimated at $730,671, approximately $563 per square foot. 5914 Lovejoy Ct is a home located in Fairfax County with nearby schools including Cardinal Forest Elementary School, Irving Middle School, and West Springfield High School.
Ownership History
Date
Name
Owned For
Owner Type
Purchase Details
Closed on
Jul 15, 2022
Sold by
Asady Kany Houman
Bought by
Charvin Laure
Current Estimated Value
Purchase Details
Closed on
May 27, 2005
Sold by
Gerard David W
Bought by
Charvin Laure and Kany,Houman Asady
Home Financials for this Owner
Home Financials are based on the most recent Mortgage that was taken out on this home.
Original Mortgage
$462,000
Interest Rate
5.83%
Mortgage Type
New Conventional
Create a Home Valuation Report for This Property
The Home Valuation Report is an in-depth analysis detailing your home's value as well as a comparison with similar homes in the area
Home Values in the Area
Average Home Value in this Area
Purchase History
| Date | Buyer | Sale Price | Title Company |
|---|---|---|---|
| Charvin Laure | $100,000 | S&T Law Group Pllc | |
| Charvin Laure | $577,500 | -- |
Source: Public Records
Mortgage History
| Date | Status | Borrower | Loan Amount |
|---|---|---|---|
| Previous Owner | Charvin Laure | $462,000 |
Source: Public Records
Tax History
| Year | Tax Paid | Tax Assessment Tax Assessment Total Assessment is a certain percentage of the fair market value that is determined by local assessors to be the total taxable value of land and additions on the property. | Land | Improvement |
|---|---|---|---|---|
| 2025 | $7,731 | $672,490 | $230,000 | $442,490 |
| 2024 | $7,731 | $667,350 | $230,000 | $437,350 |
| 2023 | $7,236 | $641,200 | $230,000 | $411,200 |
| 2022 | $6,510 | $569,310 | $215,000 | $354,310 |
| 2021 | $6,384 | $544,020 | $205,000 | $339,020 |
| 2020 | $5,989 | $506,050 | $200,000 | $306,050 |
| 2019 | $5,824 | $492,140 | $195,000 | $297,140 |
| 2018 | $5,425 | $471,760 | $195,000 | $276,760 |
| 2017 | $5,436 | $468,230 | $195,000 | $273,230 |
| 2016 | $5,424 | $468,230 | $195,000 | $273,230 |
Source: Public Records
Map
Nearby Homes
- 6003 Sherborn Ln
- 5835 Fitzhugh St
- 8526 Forrester Blvd Unit 890
- 6077 Hollow Hill Ln
- 8674 Center Rd Unit 1
- 6143 Green Hollow Ct
- 6102 Sherborn Ln
- 9077 Brook Ford Rd
- 5931 Queenston St
- 8353D Dunham Ct Unit 642
- 8333 Garfield Ct
- 5519 Yorkshire St
- 5902-B Queenston St Unit 505
- 8868 Winding Hollow Way
- 8330 Darlington St Unit 467
- 5844 Kara Place
- 8621 Kenilworth Dr
- 5809 Shana Place
- 8231K Kings Charter Ln Unit 108
- 6027 Bonnie Bern Ct
Your Personal Tour Guide
Ask me questions while you tour the home.