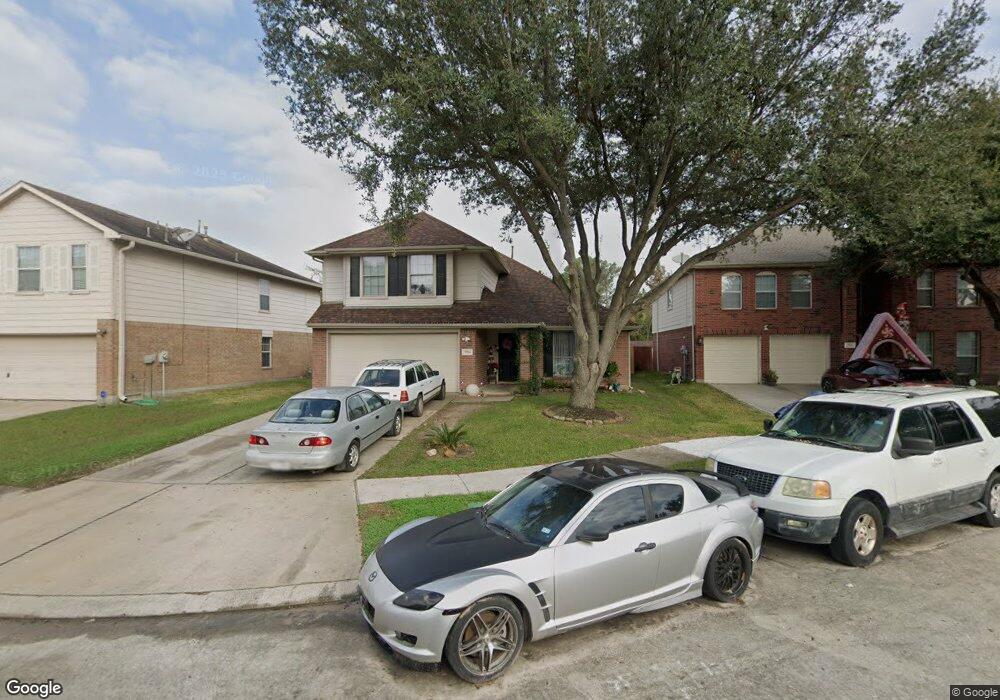
5914 NW Creek Cir Houston, TX 77086
North Houston NeighborhoodEstimated Value: $264,347 - $305,000
3
Beds
2
Baths
2,055
Sq Ft
$136/Sq Ft
Est. Value
About This Home
This home is located at 5914 NW Creek Cir, Houston, TX 77086 and is currently estimated at $278,837, approximately $135 per square foot. 5914 NW Creek Cir is a home located in Harris County with nearby schools including Kujawa EC/Pre-K/K School, Wilson Intermediate School, and Shotwell Middle School.
Ownership History
Date
Name
Owned For
Owner Type
Purchase Details
Closed on
Apr 11, 2016
Sold by
Osifeso Vickie Linn
Bought by
Quixtan Escalante Fernando F and Soto Chan Claudia Lucrecia
Current Estimated Value
Home Financials for this Owner
Home Financials are based on the most recent Mortgage that was taken out on this home.
Original Mortgage
$136,086
Outstanding Balance
$107,819
Interest Rate
3.68%
Mortgage Type
New Conventional
Estimated Equity
$171,018
Purchase Details
Closed on
Jan 2, 2004
Sold by
Kb Home Lone Star Lp
Bought by
Osifeso Vickie Linn
Home Financials for this Owner
Home Financials are based on the most recent Mortgage that was taken out on this home.
Original Mortgage
$97,128
Interest Rate
6%
Mortgage Type
Purchase Money Mortgage
Create a Home Valuation Report for This Property
The Home Valuation Report is an in-depth analysis detailing your home's value as well as a comparison with similar homes in the area
Home Values in the Area
Average Home Value in this Area
Purchase History
| Date | Buyer | Sale Price | Title Company |
|---|---|---|---|
| Quixtan Escalante Fernando F | -- | Chicago Title | |
| Osifeso Vickie Linn | -- | First American Title |
Source: Public Records
Mortgage History
| Date | Status | Borrower | Loan Amount |
|---|---|---|---|
| Open | Quixtan Escalante Fernando F | $136,086 | |
| Previous Owner | Osifeso Vickie Linn | $97,128 | |
| Closed | Osifeso Vickie Linn | $24,282 |
Source: Public Records
Tax History Compared to Growth
Tax History
| Year | Tax Paid | Tax Assessment Tax Assessment Total Assessment is a certain percentage of the fair market value that is determined by local assessors to be the total taxable value of land and additions on the property. | Land | Improvement |
|---|---|---|---|---|
| 2025 | $6,122 | $274,801 | $49,706 | $225,095 |
| 2024 | $6,122 | $264,701 | $49,706 | $214,995 |
| 2023 | $6,122 | $264,701 | $50,518 | $214,183 |
| 2022 | $5,562 | $228,513 | $38,860 | $189,653 |
| 2021 | $4,597 | $189,318 | $38,860 | $150,458 |
| 2020 | $4,900 | $181,492 | $38,860 | $142,632 |
| 2019 | $4,749 | $169,190 | $27,202 | $141,988 |
| 2018 | $2,197 | $153,017 | $27,202 | $125,815 |
| 2017 | $4,141 | $153,017 | $27,202 | $125,815 |
| 2016 | $2,955 | $143,789 | $27,202 | $116,587 |
| 2015 | $2,132 | $129,508 | $27,202 | $102,306 |
| 2014 | $2,132 | $109,852 | $27,202 | $82,650 |
Source: Public Records
Map
Nearby Homes
- 3265 Frick Rd
- 5914 Stirring Winds Ln
- 10730 Antoine Dr
- 12623 Ann Louise Rd
- 6411 Halstead Meadows Cir
- 10214 Trade Winds Dr
- 3127 Frick Rd
- 6606 Dusty Dawn Dr
- 00 Essie Rd
- 13308 Ann Louise Rd
- 6703 Deer Ridge Ln
- 6706 Redding Springs Ln
- 10306 Jillana Kaye Dr
- 6622 Sutton Meadows Dr
- 13518 Kaltenbrun Rd
- 6502 Trail Valley Way
- 6830 Desert Rose Ln
- 13610 Kaltenbrun Rd
- 2838 Packard Elm St
- 2835 Oakland Brook St
- 5918 NW Creek Cir
- 5910 NW Creek Cir
- 5922 NW Creek Cir
- 5906 NW Creek Cir
- 5926 NW Creek Cir
- 5902 NW Creek Cir
- 5930 NW Creek Cir
- 5915 NW Creek Cir
- 5919 NW Creek Cir
- 5911 NW Creek Cir
- 5903 NW Creek Cir
- 5934 NW Creek Cir
- 5923 NW Creek Cir
- 5907 NW Creek Cir
- 5927 NW Creek Cir
- 5938 NW Creek Cir
- 5931 NW Creek Cir
- 5942 NW Creek Cir
- 5935 NW Creek Cir
- 5939 NW Creek Cir