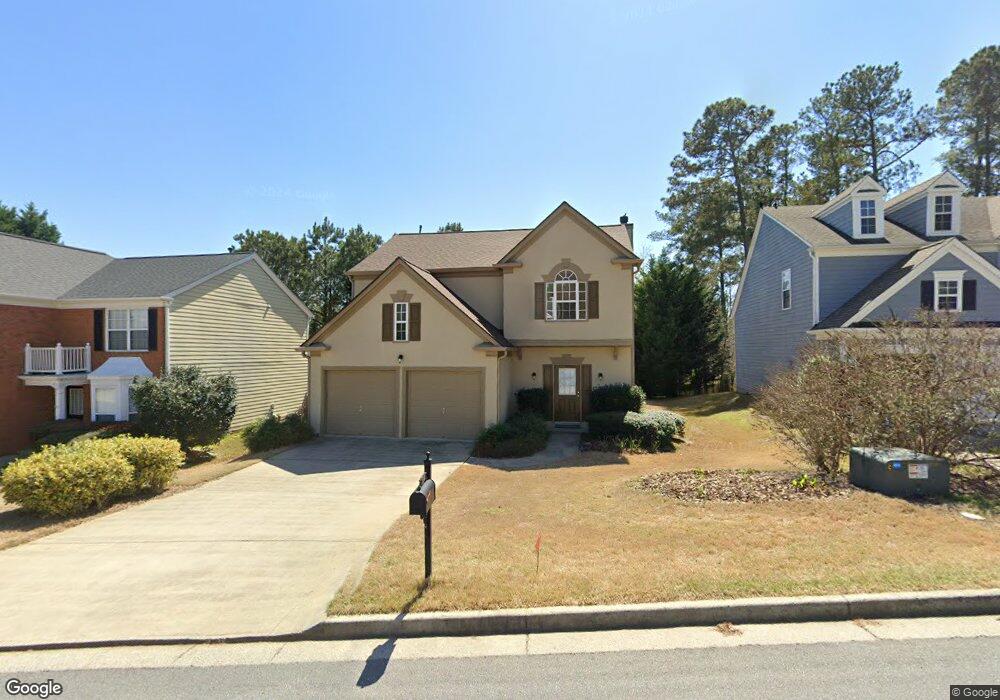
5915 Barrington Ln Alpharetta, GA 30005
Wellington NeighborhoodEstimated Value: $500,703 - $524,000
3
Beds
3
Baths
1,670
Sq Ft
$308/Sq Ft
Est. Value
About This Home
This home is located at 5915 Barrington Ln, Alpharetta, GA 30005 and is currently estimated at $514,676, approximately $308 per square foot. 5915 Barrington Ln is a home located in Fulton County with nearby schools including Taylor Road Middle School, Chattahoochee High School, and Cresco Montessori School - Johns Creek Campus.
Ownership History
Date
Name
Owned For
Owner Type
Purchase Details
Closed on
Jun 24, 2010
Sold by
Federal Natl Mtg Assn Fnma
Bought by
Clinton Anthony and Clinton Cindy
Current Estimated Value
Home Financials for this Owner
Home Financials are based on the most recent Mortgage that was taken out on this home.
Original Mortgage
$161,483
Outstanding Balance
$109,702
Interest Rate
5.25%
Mortgage Type
FHA
Estimated Equity
$404,974
Purchase Details
Closed on
Jul 7, 2009
Sold by
Wells Fargo Bk Na
Bought by
Federal Natl Mtg Assn Fnma
Purchase Details
Closed on
Sep 7, 2007
Sold by
Goodart James and Goodart Tiffany C
Bought by
Choi Sang K
Home Financials for this Owner
Home Financials are based on the most recent Mortgage that was taken out on this home.
Original Mortgage
$228,500
Interest Rate
6.55%
Mortgage Type
New Conventional
Purchase Details
Closed on
Oct 20, 1997
Sold by
Pulte Home Corp
Bought by
Powers Paul F and Powers Linda B
Create a Home Valuation Report for This Property
The Home Valuation Report is an in-depth analysis detailing your home's value as well as a comparison with similar homes in the area
Home Values in the Area
Average Home Value in this Area
Purchase History
| Date | Buyer | Sale Price | Title Company |
|---|---|---|---|
| Clinton Anthony | -- | -- | |
| Federal Natl Mtg Assn Fnma | -- | -- | |
| Wells Fargo Bk Na | $195,806 | -- | |
| Choi Sang K | $228,500 | -- | |
| Powers Paul F | $151,900 | -- |
Source: Public Records
Mortgage History
| Date | Status | Borrower | Loan Amount |
|---|---|---|---|
| Open | Clinton Anthony | $161,483 | |
| Previous Owner | Choi Sang K | $228,500 | |
| Closed | Powers Paul F | -- |
Source: Public Records
Tax History Compared to Growth
Tax History
| Year | Tax Paid | Tax Assessment Tax Assessment Total Assessment is a certain percentage of the fair market value that is determined by local assessors to be the total taxable value of land and additions on the property. | Land | Improvement |
|---|---|---|---|---|
| 2025 | $2,539 | $191,400 | $49,640 | $141,760 |
| 2023 | $4,871 | $172,560 | $31,560 | $141,000 |
| 2022 | $2,425 | $138,440 | $31,440 | $107,000 |
| 2021 | $2,389 | $112,880 | $24,160 | $88,720 |
| 2020 | $2,401 | $109,040 | $22,880 | $86,160 |
| 2019 | $290 | $113,000 | $25,640 | $87,360 |
| 2018 | $2,666 | $98,720 | $20,080 | $78,640 |
| 2017 | $2,332 | $80,680 | $15,680 | $65,000 |
| 2016 | $2,290 | $80,680 | $15,680 | $65,000 |
| 2015 | $2,308 | $80,480 | $15,680 | $64,800 |
| 2014 | $2,171 | $74,600 | $15,080 | $59,520 |
Source: Public Records
Map
Nearby Homes
- 775 Ellsborough Ct
- 640 Arncliffe Ct Unit 1
- 11420 Crossington Rd
- 130 Wyndlam Ct
- 5785 Oxborough Way Unit 1
- 11260 Donnington Dr
- 230 Sessingham Ln
- 11615 Windbrooke Way
- 5610 N Hillbrooke Trace
- 1660 Gladewood Dr
- 5575 Ashwind Trace
- 5690 Abbotts Bridge Rd
- 5680 Abbotts Bridge Rd
- 11235 Surrey Park Trail
- 11205 Abbotts Station Dr
- 335 Dunhill Way Ct
- 11915 Carriage Park Ln
- 5925 Barrington Ln Unit 1
- 5905 Barrington Ln
- 5935 Barrington Ln
- 5895 Barrington Ln
- 485 Chippenham Ct
- 5945 Barrington Ln
- 0 Chippenham Ct Unit 7315908
- 0 Chippenham Ct Unit 3210443
- 0 Chippenham Ct Unit 8835984
- 0 Chippenham Ct Unit 8601649
- 0 Chippenham Ct Unit 8393886
- 0 Chippenham Ct Unit 7329920
- 0 Chippenham Ct Unit 7135194
- 0 Chippenham Ct
- 495 Chippenham Ct Unit 2
- 465 Chippenham Ct Unit 2
- 5900 Barrington Ln
- 5885 Barrington Ln
- 5910 Barrington Ln Unit 1
- 5890 Barrington Ln