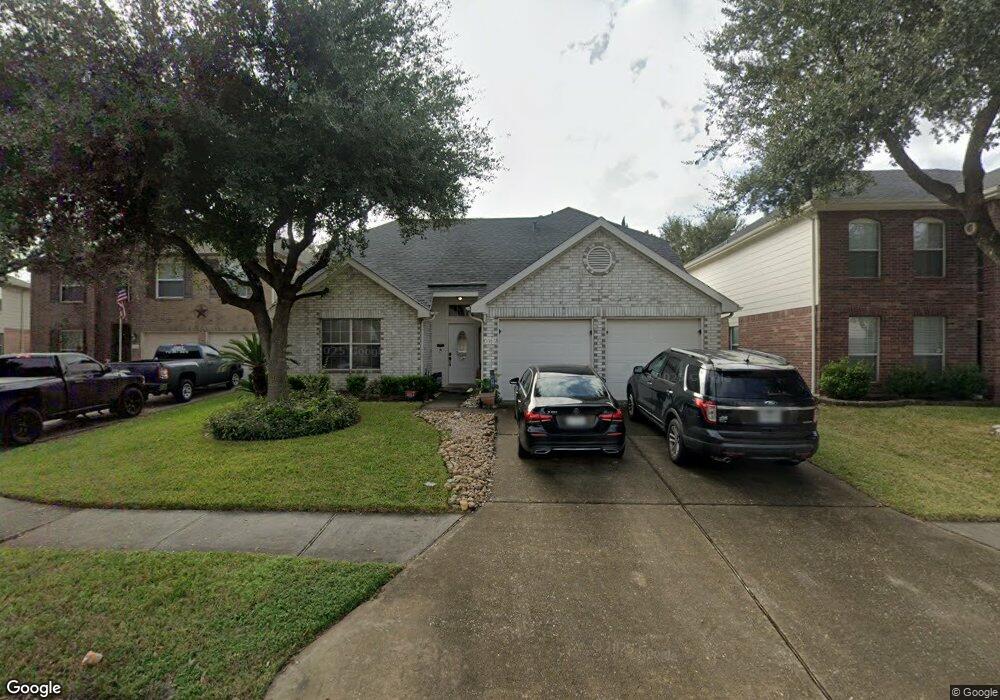
5915 NW Creek Cir Houston, TX 77086
North Houston NeighborhoodEstimated Value: $255,264 - $305,000
3
Beds
2
Baths
2,090
Sq Ft
$131/Sq Ft
Est. Value
About This Home
This home is located at 5915 NW Creek Cir, Houston, TX 77086 and is currently estimated at $274,816, approximately $131 per square foot. 5915 NW Creek Cir is a home located in Harris County with nearby schools including Kujawa EC/Pre-K/K School, Wilson Intermediate School, and Shotwell Middle School.
Ownership History
Date
Name
Owned For
Owner Type
Purchase Details
Closed on
Jun 28, 2007
Sold by
Hud
Bought by
Williams Jane G
Current Estimated Value
Home Financials for this Owner
Home Financials are based on the most recent Mortgage that was taken out on this home.
Original Mortgage
$100,900
Outstanding Balance
$62,037
Interest Rate
6.19%
Mortgage Type
Purchase Money Mortgage
Estimated Equity
$212,779
Purchase Details
Closed on
Aug 1, 2006
Sold by
Bright Brigette C and Bright George O
Bought by
Washington Mutual Bank
Purchase Details
Closed on
Apr 30, 2003
Sold by
Kb Home Lone Star Lp
Bought by
Bright George C and Bright Brigette C
Home Financials for this Owner
Home Financials are based on the most recent Mortgage that was taken out on this home.
Original Mortgage
$133,946
Interest Rate
5.77%
Mortgage Type
FHA
Create a Home Valuation Report for This Property
The Home Valuation Report is an in-depth analysis detailing your home's value as well as a comparison with similar homes in the area
Home Values in the Area
Average Home Value in this Area
Purchase History
| Date | Buyer | Sale Price | Title Company |
|---|---|---|---|
| Williams Jane G | -- | First American Title | |
| Washington Mutual Bank | $164,424 | None Available | |
| Hud | -- | None Available | |
| Bright George C | -- | First American Title Ins Co |
Source: Public Records
Mortgage History
| Date | Status | Borrower | Loan Amount |
|---|---|---|---|
| Open | Williams Jane G | $100,900 | |
| Previous Owner | Bright George C | $133,946 |
Source: Public Records
Tax History Compared to Growth
Tax History
| Year | Tax Paid | Tax Assessment Tax Assessment Total Assessment is a certain percentage of the fair market value that is determined by local assessors to be the total taxable value of land and additions on the property. | Land | Improvement |
|---|---|---|---|---|
| 2025 | $4,462 | $261,929 | $36,537 | $225,392 |
| 2024 | $4,462 | $251,815 | $36,537 | $215,278 |
| 2023 | $4,462 | $251,815 | $37,349 | $214,466 |
| 2022 | $5,322 | $218,631 | $28,730 | $189,901 |
| 2021 | $4,356 | $179,384 | $28,730 | $150,654 |
| 2020 | $4,631 | $171,548 | $28,730 | $142,818 |
| 2019 | $4,555 | $162,283 | $20,111 | $142,172 |
| 2018 | $2,098 | $146,089 | $20,111 | $125,978 |
| 2017 | $3,954 | $146,089 | $20,111 | $125,978 |
| 2016 | $3,704 | $136,848 | $20,111 | $116,737 |
| 2015 | $2,788 | $122,549 | $20,111 | $102,438 |
| 2014 | $2,788 | $102,868 | $20,111 | $82,757 |
Source: Public Records
Map
Nearby Homes
- 3265 Frick Rd
- 5914 Stirring Winds Ln
- 10730 Antoine Dr
- 6411 Halstead Meadows Cir
- 12623 Ann Louise Rd
- 10214 Trade Winds Dr
- 3127 Frick Rd
- 6606 Dusty Dawn Dr
- 00 Essie Rd
- 6703 Deer Ridge Ln
- 6706 Redding Springs Ln
- 13308 Ann Louise Rd
- 10306 Jillana Kaye Dr
- 6622 Sutton Meadows Dr
- 13518 Kaltenbrun Rd
- 6502 Trail Valley Way
- 6830 Desert Rose Ln
- 6822 Dusty Dawn Dr
- 13610 Kaltenbrun Rd
- 10522 Northview Dr
- 5911 NW Creek Cir
- 5919 NW Creek Cir
- 5923 NW Creek Cir
- 5907 NW Creek Cir
- 5927 NW Creek Cir
- 5903 NW Creek Cir
- 10127 Fallmont Cir
- 5931 NW Creek Cir
- 5902 NW Creek Cir
- 5918 NW Creek Cir
- 5914 NW Creek Cir
- 5922 NW Creek Cir
- 10122 Fallmont Ct
- 10126 Fallmont Cir
- 5935 NW Creek Cir
- 5926 NW Creek Cir
- 10123 Fallmont Cir
- 5910 NW Creek Cir
- 5906 NW Creek Cir
- 10118 Fallmont Ct