
Seller's Agent in 2025
Mark Spain
Mark Spain
(678) 537-8980
50 in this area
9,722 Total Sales
Estimated Value: $246,492 - $309,000
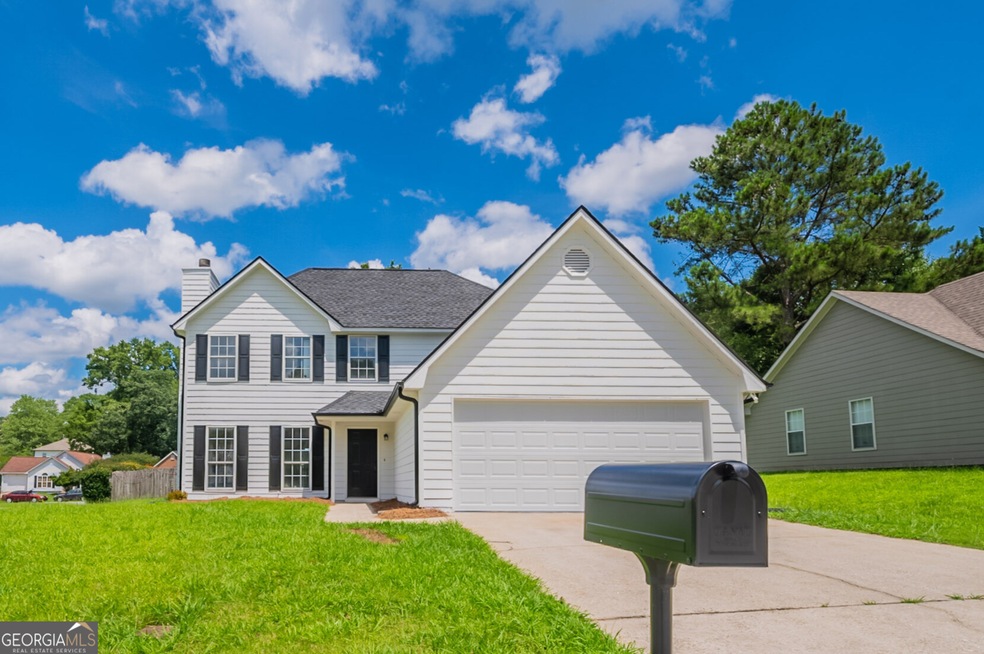
Discover comfort, convenience, and style in this beautifully renovated 3-bedroom, 2.5-bathroom home perfectly positioned on a corner lot in a quiet, established neighborhood. From the moment you arrive, you'll appreciate the charming curb appeal and the thoughtful updates that make this home truly move-in ready. Step inside to a light-filled family room with a cozy fireplace, offering a warm and welcoming space for everyday living and entertaining. The spacious layout continues into the separate dining room, ideal for hosting formal meals or casual get- togethers. The heart of the home is the stunning kitchen, which features brand-new white cabinetry, elegant quartz countertops and all new stainless-steel appliances, including a gas range-perfect for those who love to cook. The updated finishes provide a modern touch while keeping the space functional and inviting. Upstairs, the primary suite is a true retreat with a walk-in closet and a spa-inspired bathroom complete with a soaking tub, separate shower, and modern fixtures. Two additional bedrooms provide plenty of space for guests, children, or a home office, and they share a full bathroom. Recent upgrades include a new roof, new LVP flooring and carpet, new cabinets and quartz counters throughout, and fresh interior and exterior paint, ensuring peace of mind and low-maintenance living for years to come. Enjoy outdoor living in the private backyard, perfect for relaxing, gardening, or play. The corner lot provides added space and privacy, and the no HOA means you can enjoy your property with freedom and flexibility. Located just minutes from Rex Park & Recreation Center, shopping, dining, and with easy access to I-75, this home offers the perfect blend of suburban tranquility and city convenience. Whether you're a first-time buyer, growing household, or looking for a turnkey investment, this home checks all the boxes.
Last Agent to Sell the Property
Mark Spain Real Estate License #178501 Listed on: 06/19/2025
| Date | Buyer | Sale Price | Title Company |
|---|---|---|---|
| Funes Celbin Omar Funes | -- | -- | |
| Funes Celbin Omar Funes | $269,900 | -- | |
| Op Spe Phx1 Llc | $180,000 | -- | |
| Smith Juan | $80,000 | -- | |
| Swaney Jeffery M | $44,900 | -- | |
| Wells Fargo Bank | $85,900 | -- | |
| Patterson Darrell | $115,500 | -- | |
| Brandon Zenobia | $119,000 | -- |
| Date | Status | Borrower | Loan Amount |
|---|---|---|---|
| Open | Funes Celbin Omar Funes | $242,910 | |
| Previous Owner | Smith Juan | $77,533 | |
| Previous Owner | Swaney Jeffery M | $58,970 | |
| Previous Owner | Patterson Darrell | $92,400 | |
| Previous Owner | Brandon Zenobia | $117,161 |
| Date | Event | Price | List to Sale | Price per Sq Ft |
|---|---|---|---|---|
| 09/09/2025 09/09/25 | Sold | $269,900 | 0.0% | $169 / Sq Ft |
| 07/23/2025 07/23/25 | Pending | -- | -- | -- |
| 07/08/2025 07/08/25 | For Sale | $269,900 | 0.0% | $169 / Sq Ft |
| 07/01/2025 07/01/25 | Pending | -- | -- | -- |
| 06/19/2025 06/19/25 | For Sale | $269,900 | -- | $169 / Sq Ft |
| Year | Tax Paid | Tax Assessment Tax Assessment Total Assessment is a certain percentage of the fair market value that is determined by local assessors to be the total taxable value of land and additions on the property. | Land | Improvement |
|---|---|---|---|---|
| 2025 | $3,209 | $92,800 | $8,000 | $84,800 |
| 2024 | $3,239 | $92,040 | $8,000 | $84,040 |
| 2023 | $2,992 | $82,880 | $8,000 | $74,880 |
| 2022 | $2,344 | $68,760 | $8,000 | $60,760 |
| 2021 | $1,901 | $57,160 | $8,000 | $49,160 |
| 2020 | $1,595 | $48,926 | $8,000 | $40,926 |
| 2019 | $1,313 | $41,414 | $6,400 | $35,014 |
| 2018 | $1,017 | $34,120 | $6,400 | $27,720 |
| 2017 | $794 | $28,569 | $6,400 | $22,169 |
| 2016 | $705 | $26,380 | $6,400 | $19,980 |
| 2015 | $703 | $0 | $0 | $0 |
| 2014 | $553 | $22,926 | $6,400 | $16,526 |
Seller's Agent in 2025
Mark Spain
Mark Spain
(678) 537-8980
50 in this area
9,722 Total Sales
S
Seller Co-Listing Agent in 2025
Sandra Clonts
Mark Spain
(404) 542-9536
1 in this area
529 Total Sales
Buyer's Agent in 2025
Pilar Hamrick
HomeSmart
(678) 334-6791
1 in this area
251 Total Sales
Source: Georgia MLS
MLS Number: 10547041
APN: 12-0152D-00F-009
Disclaimer: Certain information contained herein is derived from information provided by parties other than Homes.com. All information provided is deemed reliable, but is not guaranteed to be accurate and should be independently verified.
![]() The data relating to real estate for sale on this web site comes in part from the Broker Reciprocity Program of Georgia MLS. Real estate listings held by brokerage firms other than Redfin are marked with the Broker Reciprocity logo and detailed information about them includes the name of the listing brokers. Information deemed reliable but not guaranteed. Copyright 2026 Georgia MLS. All rights reserved.
The data relating to real estate for sale on this web site comes in part from the Broker Reciprocity Program of Georgia MLS. Real estate listings held by brokerage firms other than Redfin are marked with the Broker Reciprocity logo and detailed information about them includes the name of the listing brokers. Information deemed reliable but not guaranteed. Copyright 2026 Georgia MLS. All rights reserved.
Ask me questions while you tour the home.