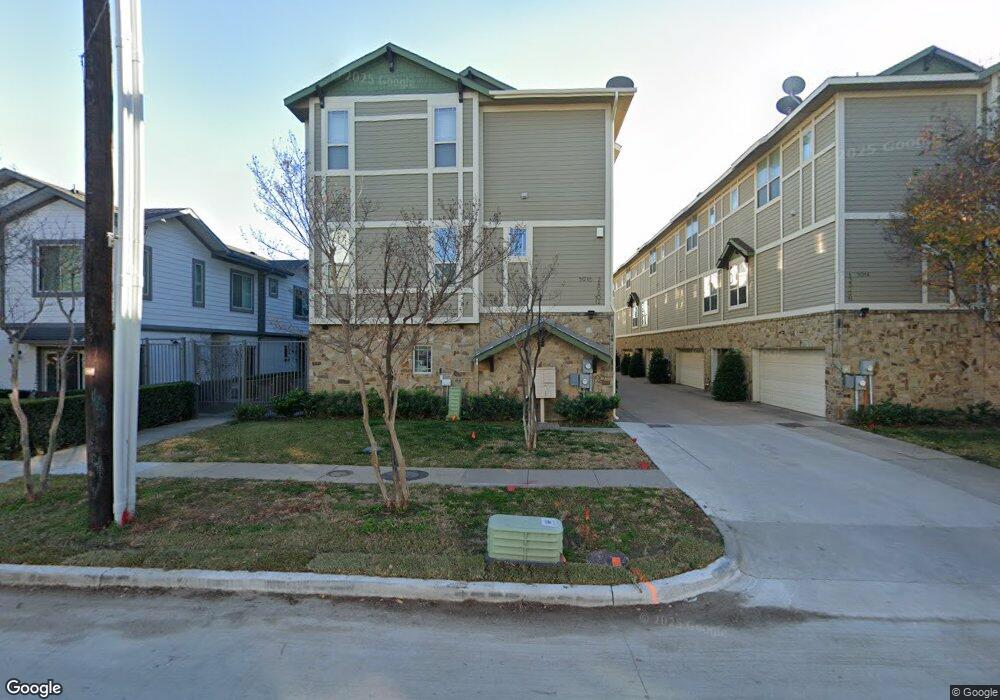
5916 Hudson St Unit 2 Dallas, TX 75206
Lower Greenville NeighborhoodEstimated Value: $501,467 - $589,000
2
Beds
3
Baths
1,849
Sq Ft
$295/Sq Ft
Est. Value
About This Home
This home is located at 5916 Hudson St Unit 2, Dallas, TX 75206 and is currently estimated at $545,617, approximately $295 per square foot. 5916 Hudson St Unit 2 is a home located in Dallas County with nearby schools including J L Long Middle School, Woodrow Wilson High School, and Uplift Peak Preparatory High School.
Ownership History
Date
Name
Owned For
Owner Type
Purchase Details
Closed on
Nov 18, 2024
Sold by
Deljavan Tina
Bought by
Deljavan Nima
Current Estimated Value
Home Financials for this Owner
Home Financials are based on the most recent Mortgage that was taken out on this home.
Original Mortgage
$360,500
Interest Rate
6.6%
Mortgage Type
New Conventional
Purchase Details
Closed on
Jul 24, 2013
Sold by
Sommers Amy E
Bought by
Deljavan Tina and Deljavan Nima S
Home Financials for this Owner
Home Financials are based on the most recent Mortgage that was taken out on this home.
Original Mortgage
$205,500
Interest Rate
3.99%
Mortgage Type
New Conventional
Purchase Details
Closed on
Sep 22, 2011
Sold by
Greenville Hudson Development Llc
Bought by
Sommers Amy E
Home Financials for this Owner
Home Financials are based on the most recent Mortgage that was taken out on this home.
Original Mortgage
$226,575
Interest Rate
4.34%
Mortgage Type
New Conventional
Create a Home Valuation Report for This Property
The Home Valuation Report is an in-depth analysis detailing your home's value as well as a comparison with similar homes in the area
Home Values in the Area
Average Home Value in this Area
Purchase History
| Date | Buyer | Sale Price | Title Company |
|---|---|---|---|
| Deljavan Nima | -- | Key Title Group | |
| Deljavan Tina | -- | Lawyers Title | |
| Sommers Amy E | -- | Hftc |
Source: Public Records
Mortgage History
| Date | Status | Borrower | Loan Amount |
|---|---|---|---|
| Previous Owner | Deljavan Nima | $360,500 | |
| Previous Owner | Deljavan Tina | $205,500 | |
| Previous Owner | Sommers Amy E | $226,575 |
Source: Public Records
Tax History Compared to Growth
Tax History
| Year | Tax Paid | Tax Assessment Tax Assessment Total Assessment is a certain percentage of the fair market value that is determined by local assessors to be the total taxable value of land and additions on the property. | Land | Improvement |
|---|---|---|---|---|
| 2025 | $10,331 | $462,250 | $96,050 | $366,200 |
| 2024 | $10,331 | $462,250 | $96,050 | $366,200 |
| 2023 | $10,331 | $425,270 | $96,050 | $329,220 |
| 2022 | $10,633 | $425,270 | $96,050 | $329,220 |
| 2021 | $9,999 | $379,050 | $64,030 | $315,020 |
| 2020 | $10,283 | $379,050 | $64,030 | $315,020 |
| 2019 | $10,785 | $379,050 | $64,030 | $315,020 |
| 2018 | $9,050 | $332,820 | $32,020 | $300,800 |
| 2017 | $9,050 | $332,820 | $32,020 | $300,800 |
| 2016 | $9,050 | $332,820 | $32,020 | $300,800 |
| 2015 | $7,532 | $274,580 | $25,610 | $248,970 |
| 2014 | $7,532 | $274,580 | $25,610 | $248,970 |
Source: Public Records
Map
Nearby Homes
- 5810 Hudson St
- 5620 Live Oak St Unit 104
- 5620 Live Oak St Unit 106
- 6020 Hudson St Unit 6
- 5909 Ross Ave Unit 2
- 5647 Live Oak St
- 5707 Lindell Ave Unit 204
- 5875 Ross Ave Unit 6
- 5966 Ross Ave
- 5820 Bryan Pkwy Unit 10
- 5810 Bryan Pkwy Unit 100
- 5705 Live Oak St Unit B
- 5963 Ross Ave Unit 202
- 5963 Ross Ave Unit 103
- 5963 Ross Ave Unit 101
- 5608 Lindell Ave Unit 3
- 5618 Lindell Ave Unit 7
- 5838 La Vista Dr
- 5515 Bryan Pkwy Unit 102
- 5609 Lewis St
- 5916 Hudson St Unit 10
- 5916 Hudson St
- 5916 Hudson St Unit 12
- 5916 Hudson St Unit 8
- 5916 Hudson St Unit 4
- 5914 Hudson St Unit 5
- 5914 Hudson St
- 5914 Hudson St Unit 4
- 5914 Hudson St Unit 3
- 5914 Hudson St Unit 9
- 5914 Hudson St Unit 11
- 5914 Hudson St Unit 7
- 5914 Hudson St Unit 1
- 5922 Hudson St
- 5922 Hudson St Unit 2
- 5922 Hudson St Unit 1
- 5922 Hudson St Unit 4
- 5908 Hudson St
- 5908 Hudson St
- 5924 Hudson St