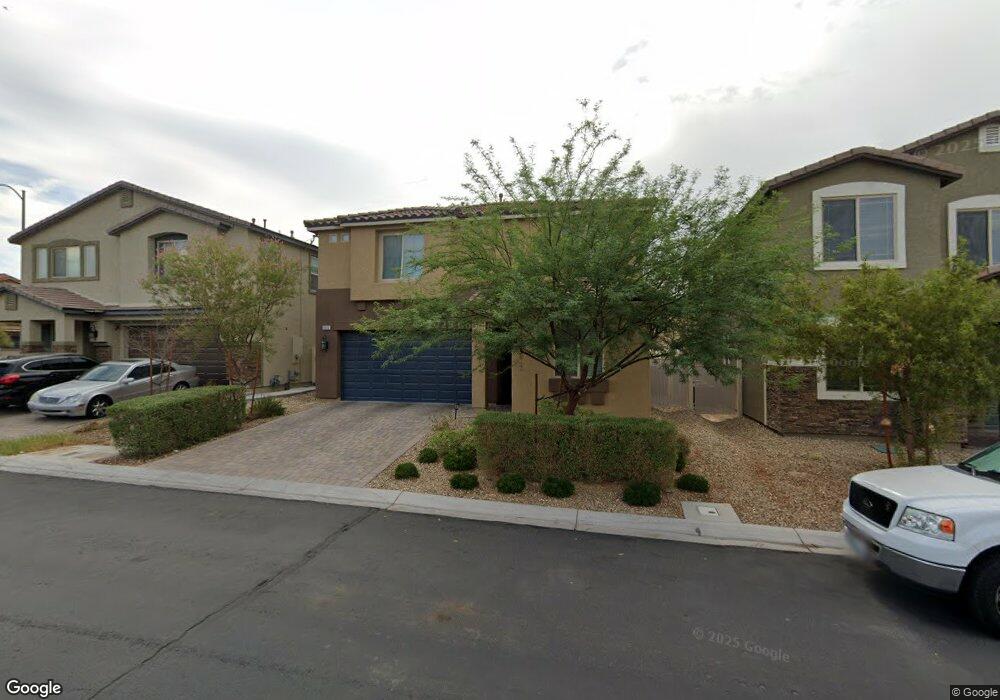
5916 Lavender Breeze St North Las Vegas, NV 89081
Northridge NeighborhoodEstimated Value: $437,077 - $470,000
3
Beds
3
Baths
2,232
Sq Ft
$203/Sq Ft
Est. Value
About This Home
This home is located at 5916 Lavender Breeze St, North Las Vegas, NV 89081 and is currently estimated at $453,269, approximately $203 per square foot. 5916 Lavender Breeze St is a home with nearby schools including D.L. Dusty Dickens Elementary School, Clifford O. Findlay Middle School, and Mojave High School.
Ownership History
Date
Name
Owned For
Owner Type
Purchase Details
Closed on
May 17, 2021
Sold by
Catanghal Anna Marice D and De Groot Travis
Bought by
Degroot Travis J and De Groot Anna
Current Estimated Value
Home Financials for this Owner
Home Financials are based on the most recent Mortgage that was taken out on this home.
Original Mortgage
$260,200
Outstanding Balance
$235,065
Interest Rate
2.9%
Mortgage Type
New Conventional
Estimated Equity
$218,204
Purchase Details
Closed on
Mar 29, 2018
Sold by
Dr Horton Inc
Bought by
Groot Travis J De and Catanghal Anna Marice D
Home Financials for this Owner
Home Financials are based on the most recent Mortgage that was taken out on this home.
Original Mortgage
$280,495
Interest Rate
4.25%
Mortgage Type
FHA
Purchase Details
Closed on
Nov 14, 2016
Sold by
Mscp Everest Villages Llc
Bought by
D R Horton Inc
Create a Home Valuation Report for This Property
The Home Valuation Report is an in-depth analysis detailing your home's value as well as a comparison with similar homes in the area
Home Values in the Area
Average Home Value in this Area
Purchase History
| Date | Buyer | Sale Price | Title Company |
|---|---|---|---|
| Degroot Travis J | -- | None Listed On Document | |
| Groot Travis J De | $285,670 | Dhi Title Of Nevada | |
| D R Horton Inc | $6,314,000 | First American Title Ncs La |
Source: Public Records
Mortgage History
| Date | Status | Borrower | Loan Amount |
|---|---|---|---|
| Open | Degroot Travis J | $260,200 | |
| Previous Owner | Groot Travis J De | $280,495 |
Source: Public Records
Tax History Compared to Growth
Tax History
| Year | Tax Paid | Tax Assessment Tax Assessment Total Assessment is a certain percentage of the fair market value that is determined by local assessors to be the total taxable value of land and additions on the property. | Land | Improvement |
|---|---|---|---|---|
| 2025 | $3,265 | $156,731 | $36,050 | $120,681 |
| 2024 | $3,171 | $156,731 | $36,050 | $120,681 |
| 2023 | $268 | $148,513 | $35,700 | $112,813 |
| 2022 | $3,079 | $122,278 | $29,050 | $93,228 |
| 2021 | $3,125 | $107,425 | $26,250 | $81,175 |
| 2020 | $2,899 | $98,655 | $26,250 | $72,405 |
| 2019 | $2,717 | $98,989 | $23,450 | $75,539 |
| 2018 | $294 | $19,271 | $19,250 | $21 |
| 2017 | $488 | $14,560 | $14,560 | $0 |
| 2016 | $268 | $15,050 | $15,050 | $0 |
| 2015 | $266 | $10,500 | $10,500 | $0 |
| 2014 | $213 | $7,700 | $7,700 | $0 |
Source: Public Records
Map
Nearby Homes
- 4104 Free Bird Crest Ave
- 4112 Carol Bailey Ave
- 6009 La Coste St
- 5945 Violet Crown St
- 5905 Middle Rock St
- 4200 Zilker Park Ave
- 4017 Kristina Lynn Ave
- 4205 Zilker Park Ave
- 4204 Seclusion Bay Ave
- 5852 Clear Haven Ln
- 6021 Vivanco St
- 4209 Zilker Park Ave
- 4212 Mount Bonnell Ave
- 4216 Mount Bonnell Ave
- 5856 Country Lake Ln
- Plan 2784 at Briscoe
- Plan 2333 Modeled at Briscoe
- Plan 2175 at Briscoe
- Plan 1453 Modeled at Briscoe
- 4016 Gaster Ave
- 5920 Lavender Breeze St Unit Lot 3074
- 5908 Lavender Breeze St
- 5917 Fox Hair St
- 5913 Fox Hair St
- 5921 Fox Hair St
- 5909 Fox Hair St
- 5904 Lavender Breeze St
- 5917 Lavender Breeze St Unit Lot 92
- 5917 Lavender Breeze St
- 5913 Lavender Breeze St
- 5921 Lavender Breeze St
- 5905 Fox Hair St
- 4048 Free Bird Crest Ave
- 5909 Lavender Breeze St
- 4052 Free Bird Crest Ave
- 4044 Free Bird Crest Ave
- 5856 Lavender Breeze St
- 4056 Free Bird Crest Ave
- 4040 Free Bird Crest Ave
- 5857 Fox Hair St Unit Lot 3068