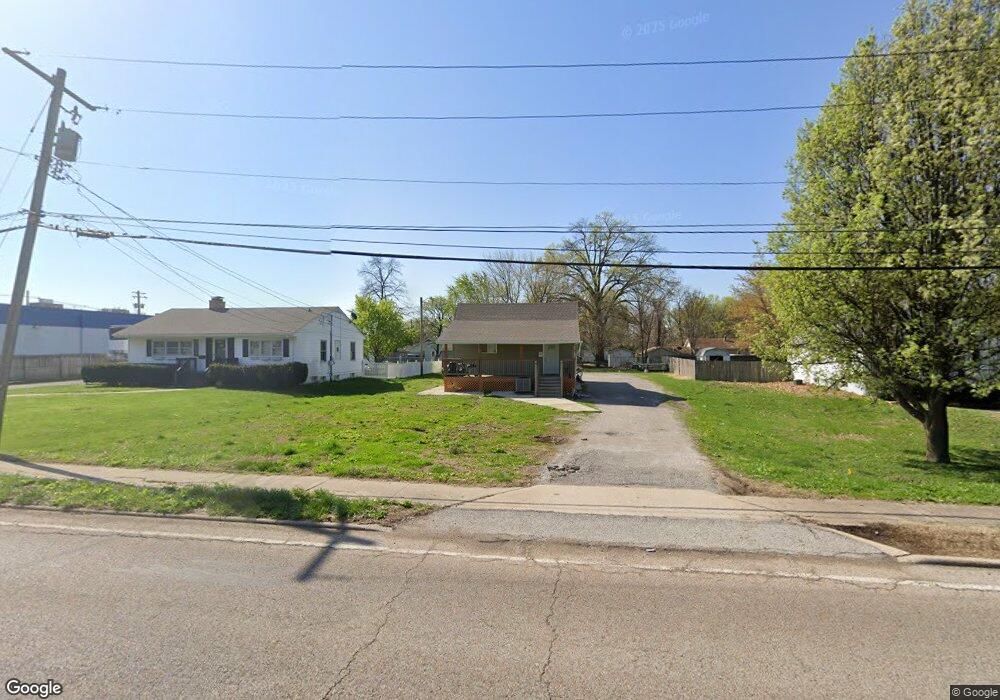
5916 N Belt W Unit A Belleville, IL 62223
Estimated Value: $150,000 - $170,000
--
Bed
--
Bath
748
Sq Ft
$214/Sq Ft
Est. Value
About This Home
This home is located at 5916 N Belt W Unit A, Belleville, IL 62223 and is currently estimated at $159,939, approximately $213 per square foot. 5916 N Belt W Unit A is a home located in St. Clair County with nearby schools including Ellis Elementary School, Emge Junior High School, and Our Lady Queen Of Peace Catholic School.
Ownership History
Date
Name
Owned For
Owner Type
Purchase Details
Closed on
Feb 9, 2022
Sold by
Qunni Atiya
Bought by
Sbkp Properties Llc
Current Estimated Value
Purchase Details
Closed on
Jan 22, 2021
Sold by
Qunni Tareq N and Abdelfatah Yasmin K
Bought by
Qunni Atiya
Purchase Details
Closed on
Jul 22, 2019
Sold by
Sf2 Llc
Bought by
Qunni Tareq N and Abdelfatah Yasmin K
Purchase Details
Closed on
Mar 15, 2018
Sold by
Citizens Community Bank
Bought by
Sf3 Llc
Purchase Details
Closed on
Aug 24, 2017
Sold by
T Bow Inc and Bow Thomas A
Bought by
Citizens Community Bank
Purchase Details
Closed on
Feb 26, 2015
Sold by
Dallas Plastering Company
Bought by
T Bow Inc
Purchase Details
Closed on
Nov 12, 2014
Sold by
Statham Hary M and Statham Rose A
Bought by
Dallas Plastering Company
Home Financials for this Owner
Home Financials are based on the most recent Mortgage that was taken out on this home.
Original Mortgage
$34,000
Interest Rate
4.25%
Mortgage Type
Purchase Money Mortgage
Create a Home Valuation Report for This Property
The Home Valuation Report is an in-depth analysis detailing your home's value as well as a comparison with similar homes in the area
Home Values in the Area
Average Home Value in this Area
Purchase History
| Date | Buyer | Sale Price | Title Company |
|---|---|---|---|
| Sbkp Properties Llc | $125,000 | Benchmark Title | |
| Qunni Atiya | -- | None Available | |
| Qunni Tareq N | $30,000 | First American | |
| Sf3 Llc | $33,000 | Attorney | |
| Citizens Community Bank | -- | Attorney | |
| T Bow Inc | -- | Community Title Shiloh Llc | |
| Dallas Plastering Company | $20,000 | Community Title Shiloh Llc |
Source: Public Records
Mortgage History
| Date | Status | Borrower | Loan Amount |
|---|---|---|---|
| Previous Owner | Dallas Plastering Company | $34,000 |
Source: Public Records
Tax History Compared to Growth
Tax History
| Year | Tax Paid | Tax Assessment Tax Assessment Total Assessment is a certain percentage of the fair market value that is determined by local assessors to be the total taxable value of land and additions on the property. | Land | Improvement |
|---|---|---|---|---|
| 2024 | $3,472 | $41,329 | $7,741 | $33,588 |
| 2023 | $3,246 | $37,083 | $6,946 | $30,137 |
| 2022 | $3,082 | $33,651 | $6,303 | $27,348 |
| 2021 | $2,886 | $30,359 | $5,852 | $24,507 |
| 2020 | $2,770 | $28,175 | $5,694 | $22,481 |
| 2019 | $2,762 | $28,175 | $5,694 | $22,481 |
| 2018 | $2,682 | $26,923 | $5,441 | $21,482 |
| 2017 | $2,796 | $25,074 | $5,067 | $20,007 |
| 2016 | $2,976 | $29,583 | $5,730 | $23,853 |
| 2014 | $2,699 | $29,753 | $5,763 | $23,990 |
| 2013 | $1,515 | $31,743 | $6,148 | $25,595 |
Source: Public Records
Map
Nearby Homes
- 6005 N Belt W
- 22 Terrace Dr
- 2819 Frank Scott Pkwy W
- 408 Rosewood Ct
- 6204 Warren Dr
- 18 Jonathon Lee Dr
- 4720 Ruth St
- 44 Gatewood Ct
- 102 Kensington Heights Rd
- 102 Kingsway Dr
- 53 Paulette Dr
- 3 Lynnwood Ct
- 11 Kingsway Dr
- 412 Springdale Dr
- 5316 W Main St
- 22 Elizabeth Dr
- 8 S 51st St
- 19 S 56th St
- 108 Chevy Chase Dr
- 12 Lynnwood Ct
- 5916 N Belt W
- 5912 N Belt W
- 5920 N Belt W
- 5909 Wilson Dr
- 5905 Wilson Dr
- 5924 N Belt W
- 5913 Wilson Dr
- 5917 Wilson Dr
- 2617 Frank Scott Pkwy W
- 5928 N Belt W
- 5921 Wilson Dr
- 5908 Wilson Dr
- 5950 N Belt W
- 5918 Wilson Dr
- 6014 Midway Cir
- 2707 Frank Scott Pkwy W
- 6018 Midway Cir
- 5935 N Belt W
- 2715 Frank Scott Pkwy W
- 2711 Frank Scott Pkwy W