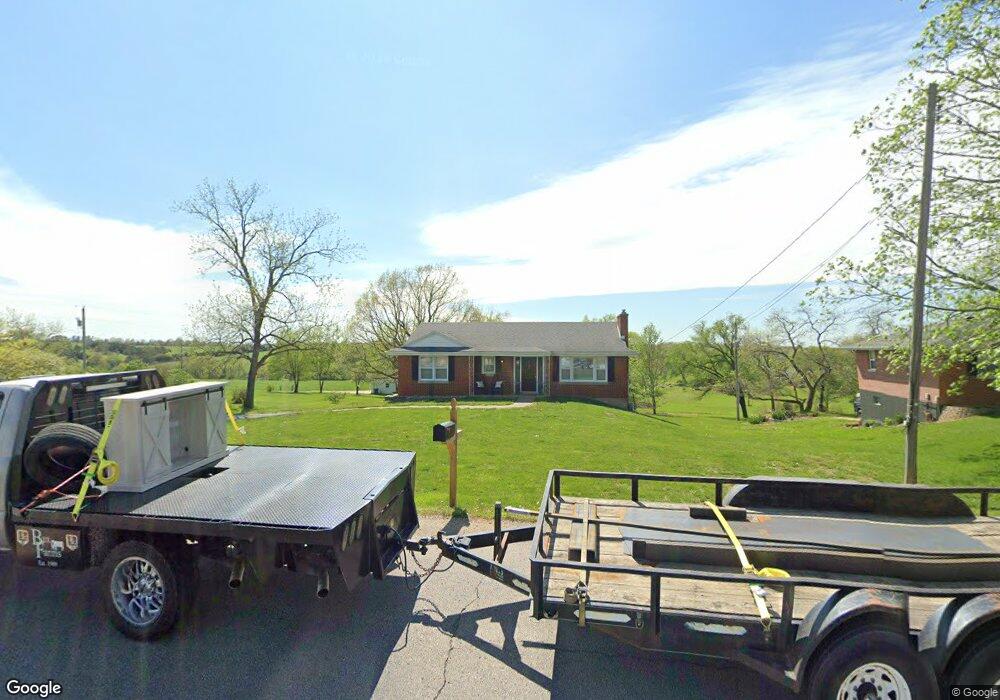
5916 Route B Jefferson City, MO 65101
Estimated Value: $214,000 - $267,000
2
Beds
2
Baths
1,162
Sq Ft
$211/Sq Ft
Est. Value
About This Home
This home is located at 5916 Route B, Jefferson City, MO 65101 and is currently estimated at $245,085, approximately $210 per square foot. 5916 Route B is a home located in Cole County with nearby schools including Blair Oaks Elementary School, Blair Oaks Middle School, and Blair Oaks High School.
Ownership History
Date
Name
Owned For
Owner Type
Purchase Details
Closed on
Feb 28, 2020
Sold by
Bruemmer Zachery L
Bought by
Bruemmer Brian L and Bruemmer Karrie L
Current Estimated Value
Home Financials for this Owner
Home Financials are based on the most recent Mortgage that was taken out on this home.
Original Mortgage
$128,000
Interest Rate
3.6%
Mortgage Type
New Conventional
Purchase Details
Closed on
Dec 30, 2019
Sold by
Goeller Allison
Bought by
Bruemmer Zachery L
Home Financials for this Owner
Home Financials are based on the most recent Mortgage that was taken out on this home.
Original Mortgage
$128,000
Interest Rate
3.6%
Mortgage Type
New Conventional
Purchase Details
Closed on
Nov 30, 2018
Sold by
Roling Troy D
Bought by
Goeller Allison F
Home Financials for this Owner
Home Financials are based on the most recent Mortgage that was taken out on this home.
Original Mortgage
$147,440
Interest Rate
4.8%
Mortgage Type
New Conventional
Purchase Details
Closed on
Feb 1, 2017
Sold by
Janell Melinda
Bought by
Rolling Troy D
Create a Home Valuation Report for This Property
The Home Valuation Report is an in-depth analysis detailing your home's value as well as a comparison with similar homes in the area
Home Values in the Area
Average Home Value in this Area
Purchase History
| Date | Buyer | Sale Price | Title Company |
|---|---|---|---|
| Bruemmer Brian L | -- | None Available | |
| Bruemmer Zachery L | -- | None Available | |
| Goeller Allison F | -- | -- | |
| Rolling Troy D | -- | -- |
Source: Public Records
Mortgage History
| Date | Status | Borrower | Loan Amount |
|---|---|---|---|
| Previous Owner | Bruemmer Zachery L | $128,000 | |
| Previous Owner | Goeller Allison F | $147,440 |
Source: Public Records
Tax History Compared to Growth
Tax History
| Year | Tax Paid | Tax Assessment Tax Assessment Total Assessment is a certain percentage of the fair market value that is determined by local assessors to be the total taxable value of land and additions on the property. | Land | Improvement |
|---|---|---|---|---|
| 2025 | $1,318 | $26,660 | $3,040 | $23,620 |
| 2024 | $1,318 | $23,940 | $0 | $23,940 |
| 2023 | $1,247 | $23,940 | $0 | $23,940 |
| 2022 | $1,251 | $23,940 | $0 | $23,940 |
| 2021 | $1,250 | $23,940 | $0 | $23,940 |
| 2020 | $1,251 | $23,940 | $3,040 | $20,900 |
| 2019 | $1,252 | $23,940 | $3,040 | $20,900 |
| 2018 | $884 | $20,767 | $3,040 | $17,727 |
| 2017 | $832 | $17,955 | $3,040 | $14,915 |
| 2016 | -- | $17,955 | $3,040 | $14,915 |
| 2015 | $837 | $0 | $0 | $0 |
| 2014 | $837 | $17,955 | $3,040 | $14,915 |
Source: Public Records
Map
Nearby Homes
- 5608 Birch Creek Ln
- 5605 Dogwood Trail
- 816 Friendship Rd
- 5710 Tanner Bridge Rd
- 7221 Castle Rock Rd
- 121 Highland Waye
- 5413 Aberdeen
- 5413 Aberdeen Waye
- 5610 Roling Rd
- 3510 Christian Ridge
- 1307 Tara Rd
- 3708 Christian Ridge
- 517 Whispering Cedars Ln
- 510 Whispering Cedars Ln
- 504 Whispering Cedars Ln
- 601 Whispering Cedars Ln
- 616 Whispering Cedars Ln
- 605 Whispering Cedars Ln
- 3814 Pear Tree Ct
- 609 Whispering Cedars Ln
- 5910 Route B
- 6006 Route B
- 6100 Route B
- 5906 Route B
- 6001 Route B
- 5915 Route B
- 5902 Route B
- 5907 Route B
- 5814 Route B
- 6014 Route B
- 5825 Cobblestone Ct
- 5817 Cobblestone Ct
- 5905 Cobblestone Ct
- 5919 Cobblestone Ct
- 1516 Friendship Rd
- 5805 Wardsville Rd
- 6110 Route B
- 6113 Route B
- 5816 Cobblestone Ct
- 5824 Cobblestone Ct