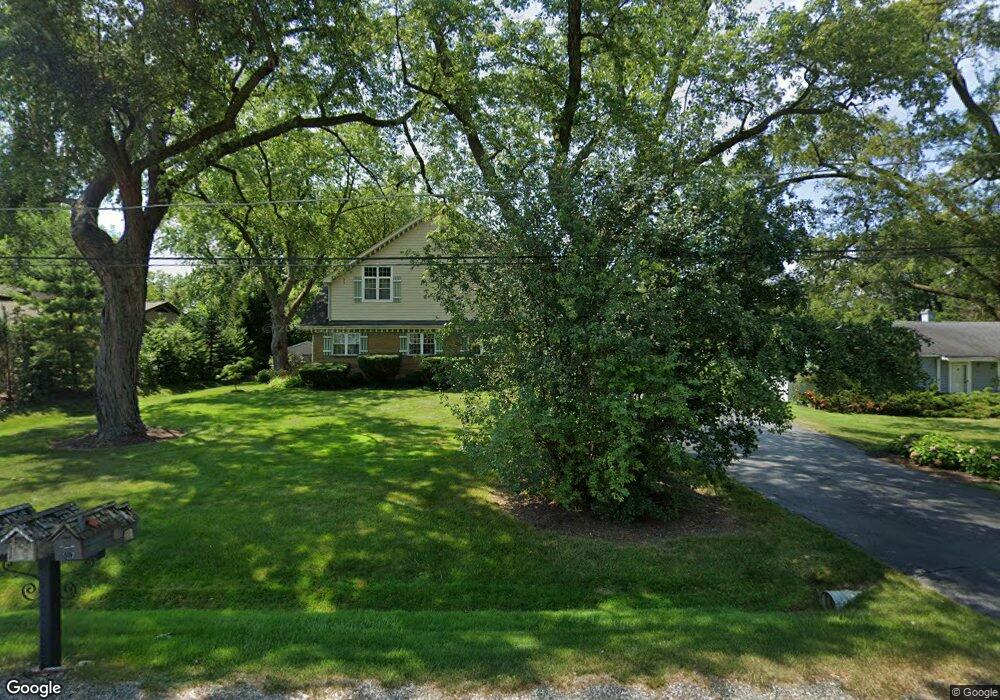
5916 S Franklin Ave Unit 2 La Grange Highlands, IL 60525
Estimated Value: $553,402 - $909,000
5
Beds
2
Baths
2,179
Sq Ft
$305/Sq Ft
Est. Value
About This Home
This home is located at 5916 S Franklin Ave Unit 2, La Grange Highlands, IL 60525 and is currently estimated at $665,351, approximately $305 per square foot. 5916 S Franklin Ave Unit 2 is a home located in Cook County with nearby schools including Highlands Elementary School, Highlands Middle School, and Lyons Township High School.
Ownership History
Date
Name
Owned For
Owner Type
Purchase Details
Closed on
Jun 19, 1998
Sold by
Ladd Virginia R and Lottes Virginia R
Bought by
Tolomeo Michael W and Tolomeo Elizabeth M
Current Estimated Value
Home Financials for this Owner
Home Financials are based on the most recent Mortgage that was taken out on this home.
Original Mortgage
$181,450
Outstanding Balance
$36,996
Interest Rate
7.27%
Estimated Equity
$628,355
Create a Home Valuation Report for This Property
The Home Valuation Report is an in-depth analysis detailing your home's value as well as a comparison with similar homes in the area
Home Values in the Area
Average Home Value in this Area
Purchase History
| Date | Buyer | Sale Price | Title Company |
|---|---|---|---|
| Tolomeo Michael W | $191,000 | -- |
Source: Public Records
Mortgage History
| Date | Status | Borrower | Loan Amount |
|---|---|---|---|
| Open | Tolomeo Michael W | $181,450 |
Source: Public Records
Tax History Compared to Growth
Tax History
| Year | Tax Paid | Tax Assessment Tax Assessment Total Assessment is a certain percentage of the fair market value that is determined by local assessors to be the total taxable value of land and additions on the property. | Land | Improvement |
|---|---|---|---|---|
| 2024 | $8,694 | $44,564 | $12,535 | $32,029 |
| 2023 | $8,657 | $44,564 | $12,535 | $32,029 |
| 2022 | $8,657 | $38,074 | $10,900 | $27,174 |
| 2021 | $8,251 | $38,073 | $10,900 | $27,173 |
| 2020 | $8,123 | $38,073 | $10,900 | $27,173 |
| 2019 | $8,648 | $40,529 | $9,810 | $30,719 |
| 2018 | $8,489 | $40,529 | $9,810 | $30,719 |
| 2017 | $8,284 | $40,529 | $9,810 | $30,719 |
| 2016 | $7,503 | $32,936 | $8,720 | $24,216 |
| 2015 | $7,351 | $32,936 | $8,720 | $24,216 |
| 2014 | $7,267 | $32,936 | $8,720 | $24,216 |
| 2013 | $7,611 | $35,423 | $8,720 | $26,703 |
Source: Public Records
Map
Nearby Homes
- 6001 Wolf Rd
- 1901 W Plainfield Rd
- 904 Hickory Dr
- 909 Red Oak Dr
- 5808 Wolf Rd Unit 3
- 5913 Timber Trails (Lot 59) Blvd
- 5903 Timber Trails (Lot 54) Blvd
- 5727 Howard Ave
- 5684 Wolf Rd
- 6262 Edgebrook Ln E
- 6213 Edgebrook Ln W
- 11300 Sequoya Ln
- 6008 Burr Oak (Lot 129) Dr
- 1118 Pin Oak Dr
- 5736 Willow Springs Rd
- The Bostonian Plan at Timber Trails of Western Springs
- The Astoria Plan at Timber Trails of Western Springs
- The Fenwick Plan at Timber Trails of Western Springs
- The Brunswick Plan at Timber Trails of Western Springs
- 5546 Laurel Ave
- 5920 S Franklin Ave
- 5910 S Franklin Ave
- 5930 S Franklin Ave
- 5921 Wolf Rd
- 5909 Wolf Rd
- 5900 S Franklin Ave
- 5917 S Franklin Ave
- 5931 Wolf Rd
- 5921 S Franklin Ave
- 5931 S Franklin Ave
- 5940 S Franklin Ave
- 5911 S Franklin Ave
- 5901 Wolf Rd
- 5901 S Franklin Ave
- 5941 Wolf Rd Unit 1
- 11210 Timberview Ln
- 5950 S Franklin Ave
- 11219 Timberview Ln
- 5961 Wolf Rd Unit 1
- 5838 S Franklin Ave