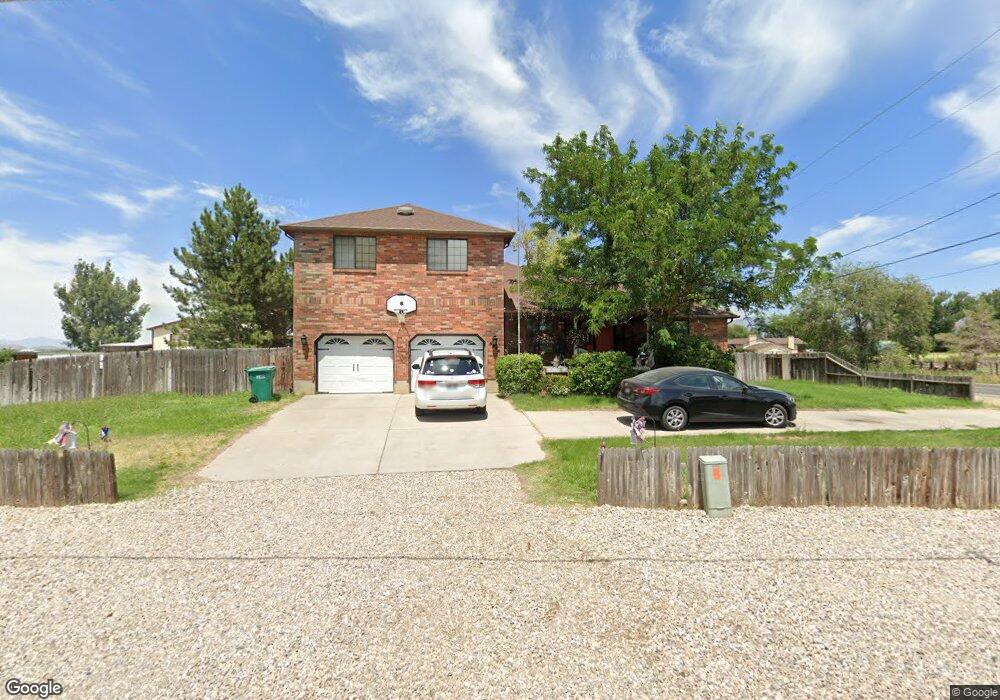
5916 W 4600 S Hooper, UT 84315
Estimated Value: $631,000 - $697,000
4
Beds
3
Baths
3,442
Sq Ft
$190/Sq Ft
Est. Value
About This Home
This home is located at 5916 W 4600 S, Hooper, UT 84315 and is currently estimated at $653,513, approximately $189 per square foot. 5916 W 4600 S is a home located in Weber County with nearby schools including Hooper Elementary School, Rocky Mountain Junior High School, and Quest Academy.
Ownership History
Date
Name
Owned For
Owner Type
Purchase Details
Closed on
May 25, 2010
Sold by
Leblanc Roger G and Leblanc Sandy J
Bought by
Leblanc Marc and Leblanc Shanna
Current Estimated Value
Purchase Details
Closed on
Aug 1, 2006
Sold by
Leblanc Marc and Leblanc Shanna
Bought by
Leblanc Marc and Leblanc Shanna
Purchase Details
Closed on
Aug 22, 1998
Sold by
Borror Garnet J
Bought by
Barrow Max L and Barrow Barbara
Home Financials for this Owner
Home Financials are based on the most recent Mortgage that was taken out on this home.
Original Mortgage
$120,000
Interest Rate
6.91%
Create a Home Valuation Report for This Property
The Home Valuation Report is an in-depth analysis detailing your home's value as well as a comparison with similar homes in the area
Home Values in the Area
Average Home Value in this Area
Purchase History
| Date | Buyer | Sale Price | Title Company |
|---|---|---|---|
| Leblanc Marc | -- | Accommodation | |
| Leblanc Marc | -- | Accommodation | |
| Leblanc Marc | -- | First American Title | |
| Barrow Max L | -- | Associated Title |
Source: Public Records
Mortgage History
| Date | Status | Borrower | Loan Amount |
|---|---|---|---|
| Previous Owner | Barrow Max L | $120,000 |
Source: Public Records
Tax History
| Year | Tax Paid | Tax Assessment Tax Assessment Total Assessment is a certain percentage of the fair market value that is determined by local assessors to be the total taxable value of land and additions on the property. | Land | Improvement |
|---|---|---|---|---|
| 2025 | $3,268 | $569,945 | $159,837 | $410,108 |
| 2024 | $3,142 | $306,899 | $87,910 | $218,989 |
| 2023 | $3,131 | $303,050 | $80,244 | $222,806 |
| 2022 | $3,089 | $305,800 | $63,590 | $242,210 |
| 2021 | $2,613 | $436,000 | $86,276 | $349,724 |
| 2020 | $2,492 | $381,000 | $50,309 | $330,691 |
| 2019 | $2,415 | $349,000 | $37,763 | $311,237 |
| 2018 | $2,300 | $318,000 | $32,802 | $285,198 |
| 2017 | $2,039 | $273,000 | $32,789 | $240,211 |
| 2016 | $1,989 | $143,764 | $23,374 | $120,390 |
| 2015 | $1,898 | $135,200 | $20,543 | $114,657 |
| 2014 | $1,813 | $125,615 | $25,039 | $100,576 |
Source: Public Records
Map
Nearby Homes
- 5957 W 4700 S
- 6036 W 4700 S
- 3729 S 5600 W Unit 6
- 3672 S 5600 W Unit 23
- 3720 S 5600 W Unit 2
- 3732 S 5600 W Unit 3
- 3719 S 5600 W Unit 7
- 6237 W 4600 S
- 4608 S 6300 W
- 4586 S 6300 W
- 4129 S 5800 W Unit 4
- 4146 S 5800 W Unit 5
- 4194 S 5800 W Unit 14
- 4168 S 5800 W Unit 12
- 4179 S 5800 W Unit 1
- 4163 S 5800 W Unit 2
- 5035 S 6150 W
- 5731 W 4100 S
- 5777 W 4100 S
- 6014 W 5300 S
Your Personal Tour Guide
Ask me questions while you tour the home.