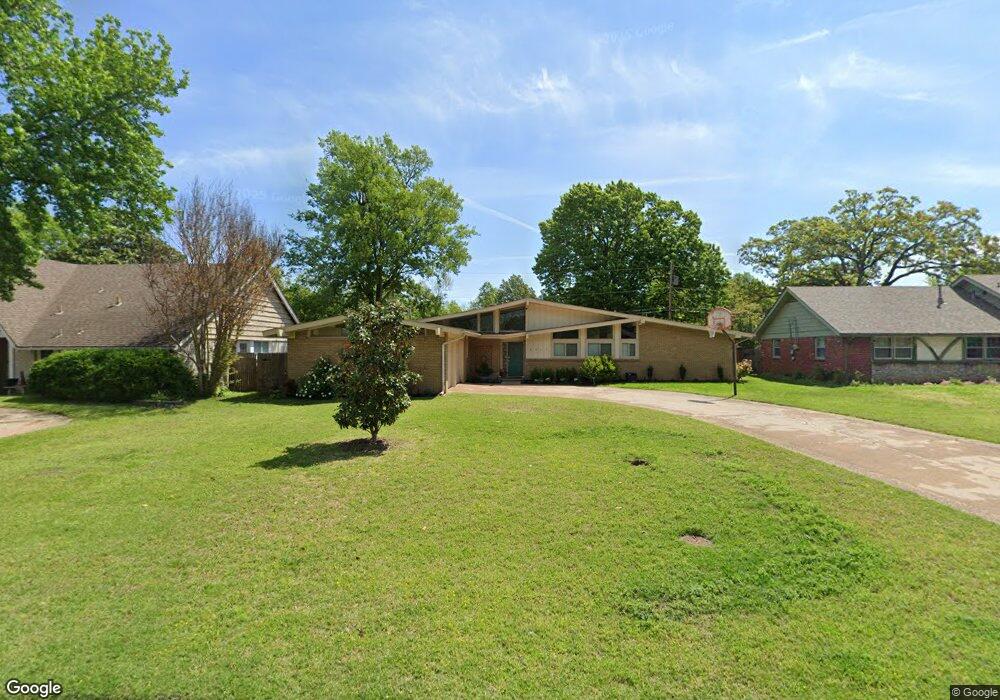
5917 S New Haven Ave Tulsa, OK 74135
Stevenson NeighborhoodEstimated Value: $354,000 - $402,000
4
Beds
3
Baths
2,213
Sq Ft
$168/Sq Ft
Est. Value
About This Home
This home is located at 5917 S New Haven Ave, Tulsa, OK 74135 and is currently estimated at $371,186, approximately $167 per square foot. 5917 S New Haven Ave is a home located in Tulsa County with nearby schools including Memorial Middle School, Memorial High School, and Peace Academy.
Ownership History
Date
Name
Owned For
Owner Type
Purchase Details
Closed on
Mar 12, 2021
Sold by
Puryear Barry and Puryear Rebecca
Bought by
Wood Tyler J
Current Estimated Value
Home Financials for this Owner
Home Financials are based on the most recent Mortgage that was taken out on this home.
Original Mortgage
$284,905
Outstanding Balance
$254,234
Interest Rate
2.7%
Mortgage Type
New Conventional
Estimated Equity
$116,952
Purchase Details
Closed on
Dec 6, 2002
Sold by
Fitzekam Douglas B and Fitzekam Rosann
Bought by
Puryear Barry and Puryear Rebecca
Home Financials for this Owner
Home Financials are based on the most recent Mortgage that was taken out on this home.
Original Mortgage
$120,000
Interest Rate
6.05%
Mortgage Type
Purchase Money Mortgage
Purchase Details
Closed on
May 28, 1999
Sold by
Dismukes Gary P and Dismukes Terri S
Bought by
Fitzekam Douglas B
Purchase Details
Closed on
Mar 1, 1989
Create a Home Valuation Report for This Property
The Home Valuation Report is an in-depth analysis detailing your home's value as well as a comparison with similar homes in the area
Home Values in the Area
Average Home Value in this Area
Purchase History
| Date | Buyer | Sale Price | Title Company |
|---|---|---|---|
| Wood Tyler J | $300,000 | Titan Title & Closing Llc | |
| Puryear Barry | $171,000 | -- | |
| Fitzekam Douglas B | $139,000 | Firstitle & Abstract Svcs In | |
| -- | $98,000 | -- |
Source: Public Records
Mortgage History
| Date | Status | Borrower | Loan Amount |
|---|---|---|---|
| Open | Wood Tyler J | $284,905 | |
| Previous Owner | Puryear Barry | $120,000 |
Source: Public Records
Tax History Compared to Growth
Tax History
| Year | Tax Paid | Tax Assessment Tax Assessment Total Assessment is a certain percentage of the fair market value that is determined by local assessors to be the total taxable value of land and additions on the property. | Land | Improvement |
|---|---|---|---|---|
| 2025 | $4,315 | $32,201 | $2,885 | $29,316 |
| 2024 | $4,395 | $30,668 | $3,344 | $27,324 |
| 2023 | $4,395 | $34,629 | $3,344 | $31,285 |
| 2022 | $4,400 | $33,000 | $3,344 | $29,656 |
| 2021 | $2,823 | $21,374 | $3,195 | $18,179 |
| 2020 | $2,784 | $21,374 | $3,195 | $18,179 |
| 2019 | $2,929 | $21,374 | $3,195 | $18,179 |
| 2018 | $2,936 | $21,374 | $3,195 | $18,179 |
| 2017 | $2,930 | $22,374 | $3,344 | $19,030 |
| 2016 | $2,869 | $22,374 | $3,344 | $19,030 |
| 2015 | $2,875 | $22,374 | $3,344 | $19,030 |
| 2014 | $2,847 | $22,374 | $3,344 | $19,030 |
Source: Public Records
Map
Nearby Homes
- 3715 E 59th St
- 4320 E 60th St
- 5921 S Sandusky Ave
- 3429 E 58th Place
- 3510 E 60th St
- 3432 E 57th Place
- 6167 S New Haven Ave
- 4354 E 60th Place
- 6228 S Pittsburg Ave
- 4312 E 56th St
- 4338 E 56th Place
- 3727 E 64th Place
- 3805 E 64th Place
- 3421 E 62nd St
- 4510 E 56th St
- 4626 E 56th Ct
- 4101 E 54th St
- 3233 E 57th St
- 6424 S Jamestown Ave
- 5651 S Winston Ave
- 5911 S New Haven Ave
- 5925 S New Haven Ave
- 3931 E 60th St
- 3927 E 60th St
- 5931 S New Haven Ave
- 5905 S New Haven Ave
- 5916 S New Haven Ave
- 3916 E 59th St
- 5924 S New Haven Ave
- 5910 S New Haven Ave
- 3922 E 59th St
- 3923 E 60th St
- 5939 S New Haven Ave
- 3935 E 60th St
- 5938 S New Haven Ave
- 5904 S New Haven Ave
- 5921 S Marion Place
- 3807 E 59th Place
- 5915 S Marion Place
- 3810 E 59th Place