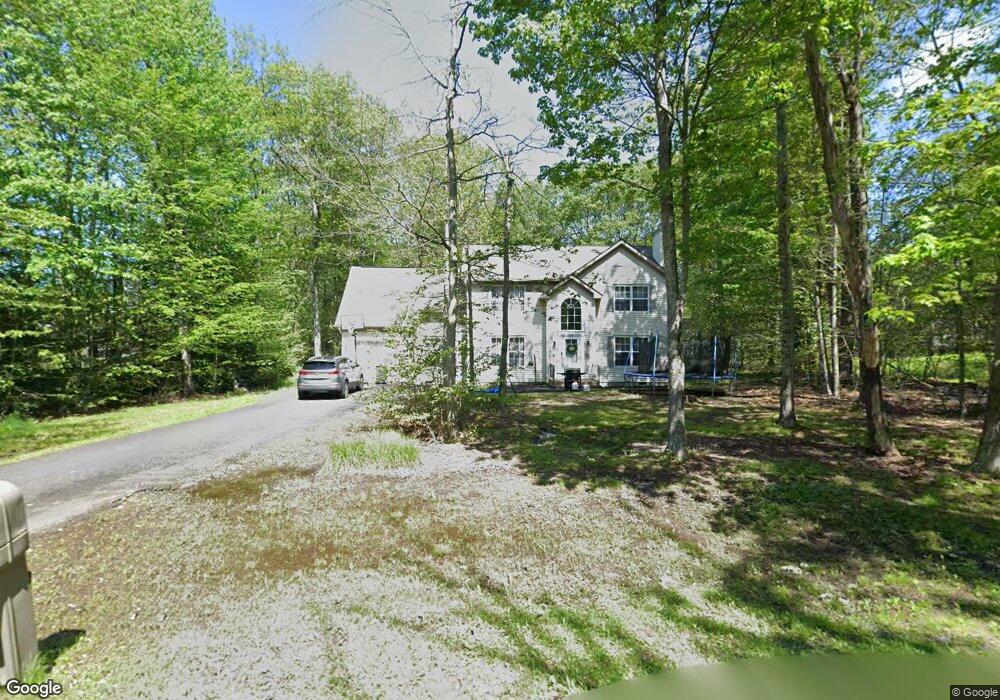
5918 Mohawk Trail Tobyhanna, PA 18466
Estimated Value: $343,000 - $371,000
3
Beds
3
Baths
2,483
Sq Ft
$144/Sq Ft
Est. Value
About This Home
This home is located at 5918 Mohawk Trail, Tobyhanna, PA 18466 and is currently estimated at $357,211, approximately $143 per square foot. 5918 Mohawk Trail is a home located in Monroe County with nearby schools including Clear Run Intermediate School, Pocono Mountain West Junior High School, and Pocono Mountain West High School.
Ownership History
Date
Name
Owned For
Owner Type
Purchase Details
Closed on
Sep 18, 2017
Sold by
Rental Growth Llc
Bought by
Policastri Nicholas and Policastri Joseph N
Current Estimated Value
Home Financials for this Owner
Home Financials are based on the most recent Mortgage that was taken out on this home.
Original Mortgage
$147,184
Outstanding Balance
$122,410
Interest Rate
3.75%
Mortgage Type
FHA
Estimated Equity
$234,801
Purchase Details
Closed on
Dec 27, 2016
Sold by
Deutsche Bank National Trust Company
Bought by
Rental Growth Llc
Home Financials for this Owner
Home Financials are based on the most recent Mortgage that was taken out on this home.
Original Mortgage
$73,520
Interest Rate
12%
Mortgage Type
Unknown
Purchase Details
Closed on
Jul 29, 2016
Sold by
Boston Olympia
Bought by
Deutsche Bank National Trust Company
Purchase Details
Closed on
May 14, 2002
Bought by
Boston Olymphia
Create a Home Valuation Report for This Property
The Home Valuation Report is an in-depth analysis detailing your home's value as well as a comparison with similar homes in the area
Home Values in the Area
Average Home Value in this Area
Purchase History
| Date | Buyer | Sale Price | Title Company |
|---|---|---|---|
| Policastri Nicholas | $149,900 | None Available | |
| Rental Growth Llc | $79,000 | Timios Inc | |
| Deutsche Bank National Trust Company | $52,904 | None Available | |
| Boston Olymphia | $189,200 | -- |
Source: Public Records
Mortgage History
| Date | Status | Borrower | Loan Amount |
|---|---|---|---|
| Open | Policastri Nicholas | $147,184 | |
| Previous Owner | Rental Growth Llc | $73,520 |
Source: Public Records
Tax History Compared to Growth
Tax History
| Year | Tax Paid | Tax Assessment Tax Assessment Total Assessment is a certain percentage of the fair market value that is determined by local assessors to be the total taxable value of land and additions on the property. | Land | Improvement |
|---|---|---|---|---|
| 2025 | $1,435 | $144,210 | $19,800 | $124,410 |
| 2024 | $1,201 | $144,210 | $19,800 | $124,410 |
| 2023 | $3,847 | $144,210 | $19,800 | $124,410 |
| 2022 | $3,778 | $144,210 | $19,800 | $124,410 |
| 2021 | $3,778 | $144,210 | $19,800 | $124,410 |
| 2020 | $1,013 | $144,210 | $19,800 | $124,410 |
| 2019 | $5,548 | $32,390 | $4,000 | $28,390 |
| 2018 | $5,548 | $32,390 | $4,000 | $28,390 |
| 2017 | $5,613 | $32,390 | $4,000 | $28,390 |
| 2016 | $1,198 | $32,390 | $4,000 | $28,390 |
| 2015 | $4,176 | $32,390 | $4,000 | $28,390 |
| 2014 | $4,176 | $32,390 | $4,000 | $28,390 |
Source: Public Records
Map
Nearby Homes
- 5193 Seneca Way
- 2144 Onondaga Way
- 1135 7 Nations Dr
- 1112 Seven Nations Dr
- 1075 Salamanca Dr
- 112 Ewe Ln
- 0 Seneca Way
- 3116 Seneca Way
- 1026 7 Nations Dr
- 1026 Seven Nations Dr
- 5116 Iroquois St
- 304 Ruger Ln
- 1127 Tomasula Dr
- 5258 Iroquois St
- 421 Fitzgerald Place
- 0 Robert David Dr Unit Lot 407
- 141 Fergus Way
- 6115 Apache Trail
- 3109 Robert David Dr
- 135 Fergus Way
- 3156 Mohawk Trail
- 5917 Mohawk Trail
- 5917 Mohawk Trail
- 3150 Mohawk Trail
- 5924 Mohawk Trail
- 5935 Seneca Ln
- 5933 Seneca Ln
- 5919 Mohawk Trail
- 5916 Mohawk Trail
- 2165 Onondaga Way
- 3114 Tutelo Way
- 5936 Seneca Ln
- 3117 Tutelo Way
- 5944 Mohawk Trail
- 3166 Mohawk Trail
- 5932 Seneca Ln
- 5937 Seneca Ln
- 2159 Onondaga Way
- 2173 Onondaga Way
- 5951 Mohawk Trail