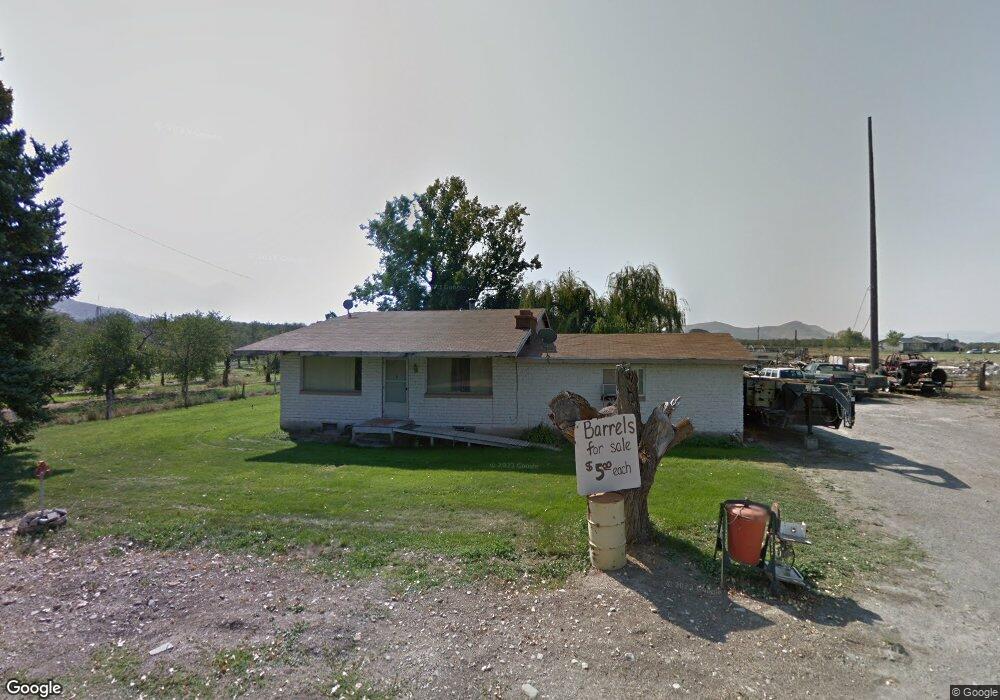
592 E 400 N Genola, UT 84655
Estimated Value: $532,000 - $1,436,000
5
Beds
5
Baths
3,640
Sq Ft
$314/Sq Ft
Est. Value
About This Home
This home is located at 592 E 400 N, Genola, UT 84655 and is currently estimated at $1,143,243, approximately $314 per square foot. 592 E 400 N is a home located in Utah County with nearby schools including Goshen Elementary school, Payson Junior High School, and Mt. Nebo Middle.
Ownership History
Date
Name
Owned For
Owner Type
Purchase Details
Closed on
Aug 26, 2019
Sold by
Gray David John and Gray Darlene L
Bought by
Johnson Trav and Johnson Diana
Current Estimated Value
Home Financials for this Owner
Home Financials are based on the most recent Mortgage that was taken out on this home.
Original Mortgage
$456,000
Outstanding Balance
$400,237
Interest Rate
3.7%
Mortgage Type
New Conventional
Estimated Equity
$743,006
Purchase Details
Closed on
Nov 23, 1999
Sold by
Gray Darlene L
Bought by
Gray David John and Gray Darlene L
Home Financials for this Owner
Home Financials are based on the most recent Mortgage that was taken out on this home.
Original Mortgage
$140,000
Interest Rate
7.84%
Create a Home Valuation Report for This Property
The Home Valuation Report is an in-depth analysis detailing your home's value as well as a comparison with similar homes in the area
Purchase History
| Date | Buyer | Sale Price | Title Company |
|---|---|---|---|
| Johnson Trav | -- | Rudd & Hawkes Ttl Ins Agcy L | |
| Gray David John | -- | Inwest Title Services Inc | |
| Gray Darlene L | -- | Inwest Title Services Inc |
Source: Public Records
Mortgage History
| Date | Status | Borrower | Loan Amount |
|---|---|---|---|
| Open | Johnson Trav | $456,000 | |
| Previous Owner | Gray Darlene L | $140,000 |
Source: Public Records
Tax History
| Year | Tax Paid | Tax Assessment Tax Assessment Total Assessment is a certain percentage of the fair market value that is determined by local assessors to be the total taxable value of land and additions on the property. | Land | Improvement |
|---|---|---|---|---|
| 2025 | $2,639 | $288,500 | -- | -- |
| 2024 | $2,639 | $272,933 | $0 | $0 |
| 2023 | $2,633 | $272,819 | $0 | $0 |
| 2022 | $2,651 | $790,900 | $479,400 | $311,500 |
| 2021 | $2,300 | $597,100 | $342,000 | $255,100 |
| 2020 | $1,870 | $552,500 | $297,400 | $255,100 |
| 2019 | $1,690 | $531,400 | $297,400 | $234,000 |
| 2018 | $32 | $531,400 | $297,400 | $234,000 |
| 2017 | $34 | $153,585 | $0 | $0 |
| 2016 | $58 | $138,539 | $0 | $0 |
| 2015 | $58 | $138,554 | $0 | $0 |
| 2014 | $55 | $132,485 | $0 | $0 |
Source: Public Records
Map
Nearby Homes
- 956 N Main St
- 1220 N Hillside Dr
- 975 E 715 S
- 893 N 260 W Unit 227
- 892 N 260 W Unit 202
- 716 W Empress St Unit 12
- 712 W Empress St Unit 14
- 712 W Empress St Unit 13
- 704 Empress St Unit 15
- 11508 S 5825 W
- 702 W Empress St Unit 16
- 214 W 930 N
- 210 W 930 N
- 206 W 930 N
- 698 Empress St Unit 17
- 694 Empress St Unit 18
- 690 W Empress St Unit 19
- 684 Empress St Unit 20
- 682 Empress St Unit 21
- 682 W Empress St
Your Personal Tour Guide
Ask me questions while you tour the home.