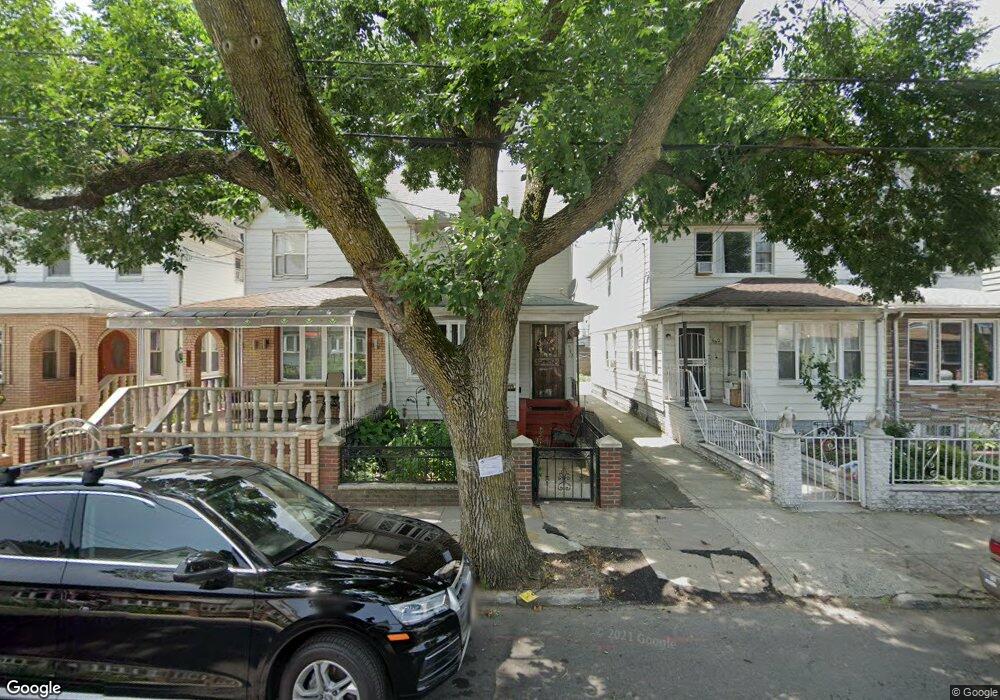
592 E 43rd St Brooklyn, NY 11203
East Flatbush NeighborhoodEstimated Value: $602,000 - $737,000
Studio
--
Bath
1,360
Sq Ft
$507/Sq Ft
Est. Value
About This Home
This home is located at 592 E 43rd St, Brooklyn, NY 11203 and is currently estimated at $690,028, approximately $507 per square foot. 592 E 43rd St is a home located in Kings County with nearby schools including P.S. 109, Andries Hudde School, and Central Brooklyn Ascend Charter.
Ownership History
Date
Name
Owned For
Owner Type
Purchase Details
Closed on
Nov 19, 2003
Sold by
Cambridge Audrey and Cambridge Natasha
Bought by
Cambridge Audrey and Cambridge Walter
Current Estimated Value
Purchase Details
Closed on
Dec 18, 2000
Sold by
Cambridge Walter
Bought by
Cambridge Walter and Cambridge Audrey
Purchase Details
Closed on
Nov 3, 1998
Sold by
Citibank Na
Bought by
Cambridge Walter and Cambridge Audrey
Purchase Details
Closed on
May 18, 1998
Sold by
Joseph Theresa
Bought by
Citibank Na
Create a Home Valuation Report for This Property
The Home Valuation Report is an in-depth analysis detailing your home's value as well as a comparison with similar homes in the area
Home Values in the Area
Average Home Value in this Area
Purchase History
| Date | Buyer | Sale Price | Title Company |
|---|---|---|---|
| Cambridge Audrey | -- | -- | |
| Cambridge Audrey | -- | -- | |
| Cambridge Walter | -- | Commonwealth Land Title Ins | |
| Cambridge Walter | -- | Commonwealth Land Title Ins | |
| Cambridge Walter | $148,500 | Commonwealth Land Title Ins | |
| Cambridge Walter | $148,500 | Commonwealth Land Title Ins | |
| Citibank Na | $169,500 | -- | |
| Citibank Na | $169,500 | -- |
Source: Public Records
Tax History
| Year | Tax Paid | Tax Assessment Tax Assessment Total Assessment is a certain percentage of the fair market value that is determined by local assessors to be the total taxable value of land and additions on the property. | Land | Improvement |
|---|---|---|---|---|
| 2025 | $5,170 | $45,660 | $12,660 | $33,000 |
| 2024 | $5,170 | $42,840 | $12,660 | $30,180 |
| 2023 | $5,001 | $45,420 | $12,660 | $32,760 |
| 2022 | $4,816 | $37,500 | $12,660 | $24,840 |
| 2021 | $4,787 | $37,500 | $12,660 | $24,840 |
| 2020 | $2,378 | $31,320 | $12,660 | $18,660 |
| 2019 | $4,490 | $30,360 | $12,660 | $17,700 |
| 2018 | $4,075 | $23,223 | $11,036 | $12,187 |
| 2017 | $4,013 | $22,856 | $10,765 | $12,091 |
| 2016 | $3,690 | $21,565 | $11,461 | $10,104 |
| 2015 | $2,162 | $21,565 | $12,972 | $8,593 |
| 2014 | $2,162 | $20,514 | $11,911 | $8,603 |
Source: Public Records
Map
Nearby Homes
- 1294 Troy Ave
- 1246 Troy Ave
- 4122 Avenue D
- 1245 Troy Ave
- 627 E 42nd St
- 1359 Albany Ave
- 1352 Troy Ave
- 4515 Foster Ave
- 1390 Troy Ave
- 4623 Avenue D
- 4404 Clarendon Rd
- 655 E 39th St
- 3906 Avenue D
- 515 E 40th St
- 1214 Schenectady Ave
- 530 E 40th St
- 708 E 39th St Unit 2
- 758 E 48th St
- 811 E 48th St
- 592 E 39th St
Your Personal Tour Guide
Ask me questions while you tour the home.