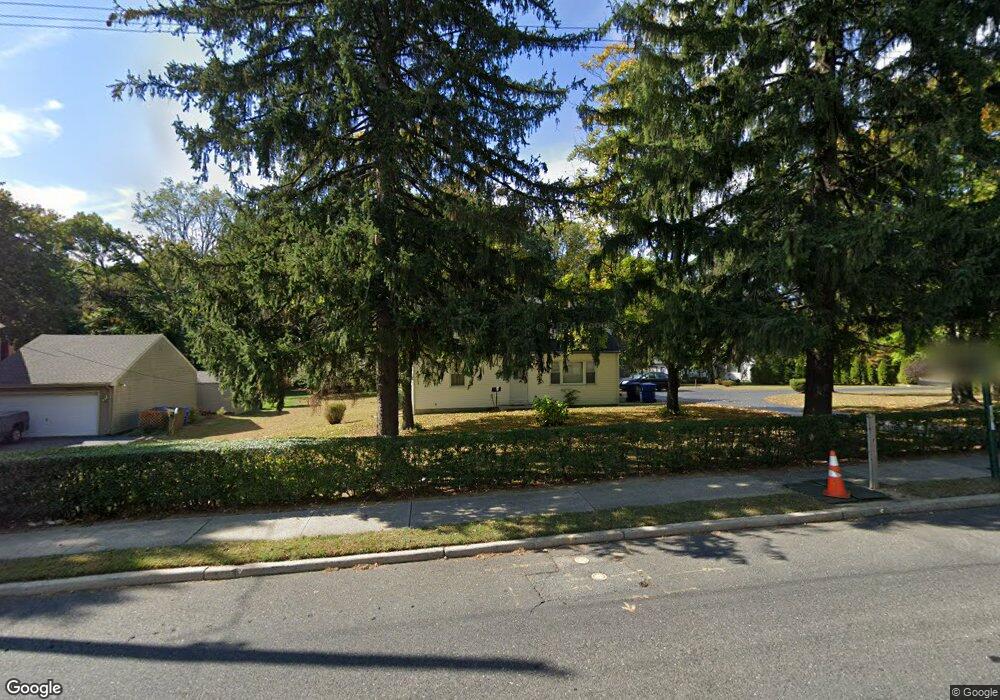
592 East Rd Middletown, NJ 07748
New Monmouth NeighborhoodEstimated Value: $441,000 - $655,000
4
Beds
2
Baths
1,305
Sq Ft
$422/Sq Ft
Est. Value
About This Home
This home is located at 592 East Rd, Middletown, NJ 07748 and is currently estimated at $550,147, approximately $421 per square foot. 592 East Rd is a home located in Monmouth County with nearby schools including Bayview Elementary School, Bayshore Middle School, and Middletown High School North.
Ownership History
Date
Name
Owned For
Owner Type
Purchase Details
Closed on
Feb 26, 2024
Sold by
Disanto Eugene A
Bought by
Disanto Brian E and Disanto Maranda
Current Estimated Value
Home Financials for this Owner
Home Financials are based on the most recent Mortgage that was taken out on this home.
Original Mortgage
$150,000
Outstanding Balance
$110,105
Interest Rate
6.66%
Mortgage Type
Seller Take Back
Estimated Equity
$440,042
Create a Home Valuation Report for This Property
The Home Valuation Report is an in-depth analysis detailing your home's value as well as a comparison with similar homes in the area
Home Values in the Area
Average Home Value in this Area
Purchase History
| Date | Buyer | Sale Price | Title Company |
|---|---|---|---|
| Disanto Brian E | $150,000 | Fidelity National Title | |
| Disanto Brian E | $150,000 | Fidelity National Title |
Source: Public Records
Mortgage History
| Date | Status | Borrower | Loan Amount |
|---|---|---|---|
| Open | Disanto Brian E | $150,000 | |
| Closed | Disanto Brian E | $150,000 |
Source: Public Records
Tax History Compared to Growth
Tax History
| Year | Tax Paid | Tax Assessment Tax Assessment Total Assessment is a certain percentage of the fair market value that is determined by local assessors to be the total taxable value of land and additions on the property. | Land | Improvement |
|---|---|---|---|---|
| 2025 | $5,950 | $377,900 | $307,500 | $70,400 |
| 2024 | $5,730 | $361,700 | $292,600 | $69,100 |
| 2023 | $5,730 | $329,700 | $244,700 | $85,000 |
| 2022 | $5,254 | $291,000 | $206,800 | $84,200 |
| 2021 | $5,254 | $255,100 | $180,200 | $74,900 |
| 2020 | $5,187 | $242,600 | $169,400 | $73,200 |
| 2019 | $5,242 | $248,200 | $169,400 | $78,800 |
| 2018 | $5,435 | $250,800 | $175,600 | $75,200 |
| 2017 | $5,564 | $254,200 | $175,600 | $78,600 |
| 2016 | $5,374 | $252,200 | $175,600 | $76,600 |
| 2015 | $5,568 | $252,300 | $175,600 | $76,700 |
| 2014 | $5,560 | $245,700 | $175,600 | $70,100 |
Source: Public Records
Map
Nearby Homes