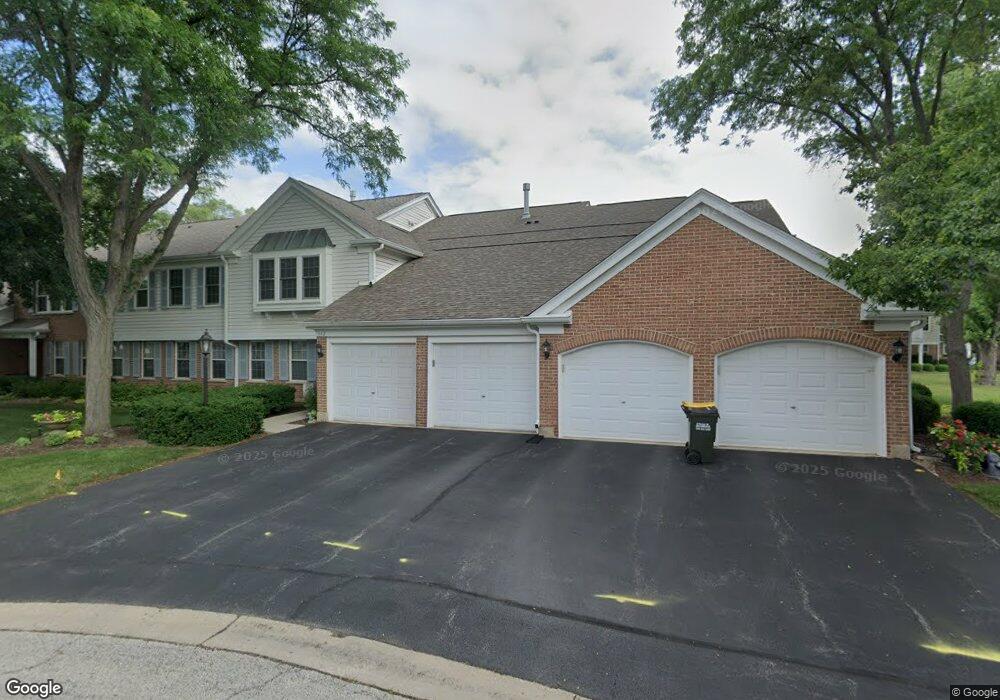
592 Edinburgh Ln Unit B Prospect Heights, IL 60070
Estimated Value: $336,000 - $349,000
2
Beds
2
Baths
1,400
Sq Ft
$244/Sq Ft
Est. Value
About This Home
This home is located at 592 Edinburgh Ln Unit B, Prospect Heights, IL 60070 and is currently estimated at $341,539, approximately $243 per square foot. 592 Edinburgh Ln Unit B is a home located in Cook County with nearby schools including Euclid Elementary School, River Trails Middle School, and John Hersey High School.
Ownership History
Date
Name
Owned For
Owner Type
Purchase Details
Closed on
Jan 15, 2021
Sold by
Obrien William E
Bought by
Obrien William E and William E Obrien Livng Trust
Current Estimated Value
Purchase Details
Closed on
Oct 20, 2017
Sold by
Johnston Anita A
Bought by
Brien William E O
Home Financials for this Owner
Home Financials are based on the most recent Mortgage that was taken out on this home.
Original Mortgage
$130,000
Outstanding Balance
$108,470
Interest Rate
3.78%
Mortgage Type
New Conventional
Estimated Equity
$233,069
Purchase Details
Closed on
Jun 30, 2005
Sold by
Deseve Christopher S and Deseve Kathleen T
Bought by
Johnston Anita A
Home Financials for this Owner
Home Financials are based on the most recent Mortgage that was taken out on this home.
Original Mortgage
$127,000
Interest Rate
5.68%
Mortgage Type
Fannie Mae Freddie Mac
Purchase Details
Closed on
Mar 8, 1997
Sold by
Bull Judith A and Baumbach Judith A
Bought by
Baumbach Brian G and Baumbach Judith A
Create a Home Valuation Report for This Property
The Home Valuation Report is an in-depth analysis detailing your home's value as well as a comparison with similar homes in the area
Home Values in the Area
Average Home Value in this Area
Purchase History
| Date | Buyer | Sale Price | Title Company |
|---|---|---|---|
| Obrien William E | -- | None Available | |
| Brien William E O | $240,000 | Chicago Title | |
| Johnston Anita A | $247,000 | Rtc | |
| Baumbach Brian G | -- | -- |
Source: Public Records
Mortgage History
| Date | Status | Borrower | Loan Amount |
|---|---|---|---|
| Open | Brien William E O | $130,000 | |
| Previous Owner | Johnston Anita A | $127,000 |
Source: Public Records
Tax History Compared to Growth
Tax History
| Year | Tax Paid | Tax Assessment Tax Assessment Total Assessment is a certain percentage of the fair market value that is determined by local assessors to be the total taxable value of land and additions on the property. | Land | Improvement |
|---|---|---|---|---|
| 2024 | $5,295 | $19,910 | $1,793 | $18,117 |
| 2023 | $4,937 | $19,910 | $1,793 | $18,117 |
| 2022 | $4,937 | $19,910 | $1,793 | $18,117 |
| 2021 | $4,538 | $16,476 | $560 | $15,916 |
| 2020 | $4,434 | $16,476 | $560 | $15,916 |
| 2019 | $4,469 | $18,457 | $560 | $17,897 |
| 2018 | $3,940 | $15,433 | $448 | $14,985 |
| 2017 | $3,906 | $15,433 | $448 | $14,985 |
| 2016 | $3,909 | $15,433 | $448 | $14,985 |
| 2015 | $3,558 | $13,454 | $896 | $12,558 |
| 2014 | $3,536 | $13,454 | $896 | $12,558 |
| 2013 | $3,433 | $13,454 | $896 | $12,558 |
Source: Public Records
Map
Nearby Homes
- 501 Aberdeen Ln Unit C
- 688 Glasgow Ln Unit 121133
- 603 Thistle Ln Unit 16185
- 212 Country Club Dr Unit 198
- 763 Sussex Corner Ln Unit 15
- 302 Lonsdale Rd
- 354 Country Club Dr
- 1214 N Crabtree Ln
- 206 E Camp Mcdonald Rd
- 1121 N Greenfield Ln
- 1116 N Westgate Rd
- 203 Coldren Dr
- 703 Newcastle Ln
- 1136 N Boxwood Dr
- 1142 N Boxwood Dr Unit B
- 300 E Marion Ave
- 1120 N Boxwood Dr Unit B
- 1000 N Westgate Rd
- 1400 N Elmhurst Rd Unit 106
- 1400 N Elmhurst Rd Unit 302
- 592 Edinburgh Ln Unit 133112
- 592 Edinburgh Ln Unit 133112
- 592 Edinburgh Ln Unit 133112
- 592 Edinburgh Ln Unit 133112
- 592 Edinburgh Ln Unit D
- 592 Edinburgh Ln Unit C
- 584 Edinburgh Ln Unit 133112
- 584 Edinburgh Ln Unit 133112
- 584 Edinburgh Ln Unit 133112
- 584 Edinburgh Ln Unit 133112
- 584 Edinburgh Ln Unit A
- 584 Edinburgh Ln Unit C
- 20 Country Club Dr Unit 1281
- 20 Country Club Dr Unit 1281
- 20 Country Club Dr Unit 1281
- 20 Country Club Dr Unit 1281
- 20 Country Club Dr Unit D
- 20 Country Club Dr Unit B
- 20 Country Club Dr Unit A
- 28 Country Club Dr Unit 1281