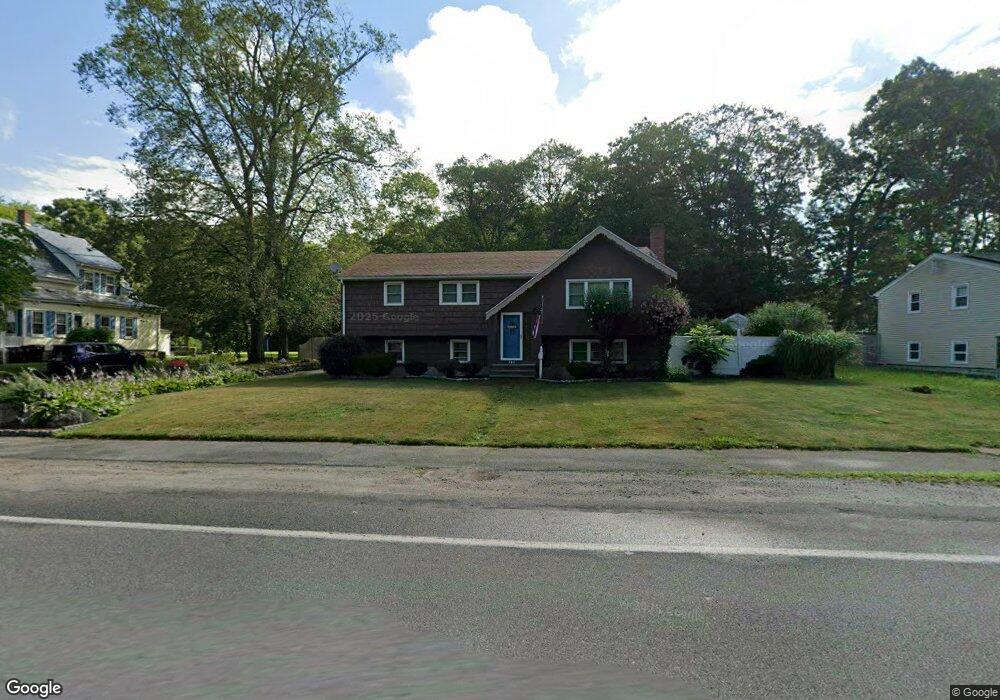
592 Plain St Brockton, MA 02302
Estimated Value: $571,374 - $623,000
4
Beds
3
Baths
1,971
Sq Ft
$305/Sq Ft
Est. Value
About This Home
This home is located at 592 Plain St, Brockton, MA 02302 and is currently estimated at $600,844, approximately $304 per square foot. 592 Plain St is a home located in Plymouth County with nearby schools including Gilmore Elementary School, Davis K-8 School, and John F. Kennedy Elementary School.
Ownership History
Date
Name
Owned For
Owner Type
Purchase Details
Closed on
Apr 2, 2001
Sold by
Mahoney Evelyn R
Bought by
Penticost Todd K and Penticost Laura J
Current Estimated Value
Home Financials for this Owner
Home Financials are based on the most recent Mortgage that was taken out on this home.
Original Mortgage
$143,250
Interest Rate
6.96%
Mortgage Type
Purchase Money Mortgage
Create a Home Valuation Report for This Property
The Home Valuation Report is an in-depth analysis detailing your home's value as well as a comparison with similar homes in the area
Purchase History
| Date | Buyer | Sale Price | Title Company |
|---|---|---|---|
| Penticost Todd K | $205,000 | -- |
Source: Public Records
Mortgage History
| Date | Status | Borrower | Loan Amount |
|---|---|---|---|
| Open | Penticost Todd K | $136,000 | |
| Closed | Penticost Todd K | $157,700 | |
| Closed | Penticost Todd K | $159,000 | |
| Closed | Penticost Todd K | $143,250 |
Source: Public Records
Tax History
| Year | Tax Paid | Tax Assessment Tax Assessment Total Assessment is a certain percentage of the fair market value that is determined by local assessors to be the total taxable value of land and additions on the property. | Land | Improvement |
|---|---|---|---|---|
| 2025 | $6,013 | $496,500 | $162,300 | $334,200 |
| 2024 | $5,847 | $486,400 | $162,300 | $324,100 |
| 2023 | $5,663 | $436,300 | $112,700 | $323,600 |
| 2022 | $5,124 | $366,800 | $102,400 | $264,400 |
| 2021 | $4,966 | $342,500 | $95,800 | $246,700 |
| 2020 | $4,906 | $323,800 | $83,800 | $240,000 |
| 2019 | $4,838 | $311,300 | $80,200 | $231,100 |
| 2018 | $4,685 | $291,700 | $80,200 | $211,500 |
| 2017 | $4,102 | $254,800 | $80,200 | $174,600 |
| 2016 | $4,095 | $235,900 | $76,500 | $159,400 |
| 2015 | $3,882 | $213,900 | $76,500 | $137,400 |
| 2014 | $3,610 | $199,100 | $76,500 | $122,600 |
Source: Public Records
Map
Nearby Homes
- 578 Plain St
- 1 Thomas Cir
- 23 Dondi Rd
- 118 Deanna Rd
- 463 Pleasant St
- 15 Wachusetts Rd
- 10 Colleen Way
- 12 Paulin Ave
- 31 Friendship Dr
- 16 Liberty St
- 55 Marjan Dr
- 18 American Ave
- 16 Jason Way
- 549 Summer St
- 323 Matfield St
- 9 Longworth Ave Unit 135
- 9 Longworth Ave Unit 113
- 15 Longworth Ave Unit 226
- 25 Longworth Ave Unit 4
- 35 Longworth Ave Unit 25
Your Personal Tour Guide
Ask me questions while you tour the home.