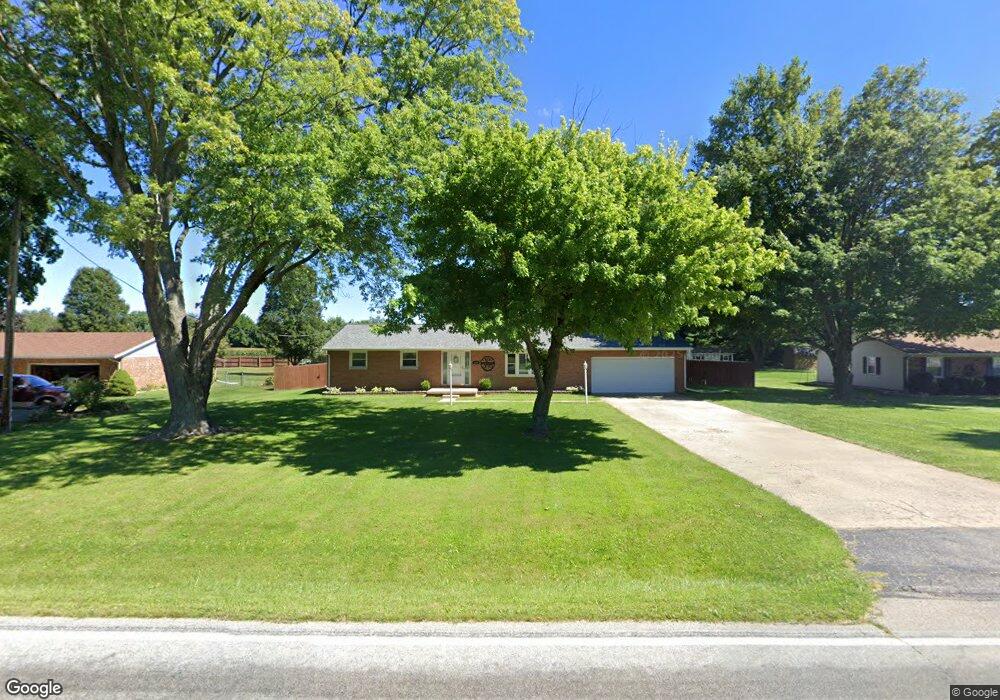
5920 Morris Rd Springfield, OH 45502
Estimated Value: $235,685 - $286,000
3
Beds
2
Baths
1,300
Sq Ft
$205/Sq Ft
Est. Value
About This Home
This home is located at 5920 Morris Rd, Springfield, OH 45502 and is currently estimated at $266,171, approximately $204 per square foot. 5920 Morris Rd is a home located in Clark County with nearby schools including Northridge Elementary School, Kenton Ridge Middle & High School, and Emmanuel Christian Academy.
Ownership History
Date
Name
Owned For
Owner Type
Purchase Details
Closed on
Jun 29, 2012
Sold by
Litterst Shirley S
Bought by
Spencer Jon M and Pinkerman Jamie C
Current Estimated Value
Home Financials for this Owner
Home Financials are based on the most recent Mortgage that was taken out on this home.
Original Mortgage
$125,000
Outstanding Balance
$85,766
Interest Rate
3.77%
Mortgage Type
New Conventional
Estimated Equity
$180,405
Create a Home Valuation Report for This Property
The Home Valuation Report is an in-depth analysis detailing your home's value as well as a comparison with similar homes in the area
Purchase History
| Date | Buyer | Sale Price | Title Company |
|---|---|---|---|
| Spencer Jon M | $122,500 | Team Title & Closing Service |
Source: Public Records
Mortgage History
| Date | Status | Borrower | Loan Amount |
|---|---|---|---|
| Open | Spencer Jon M | $125,000 |
Source: Public Records
Tax History
| Year | Tax Paid | Tax Assessment Tax Assessment Total Assessment is a certain percentage of the fair market value that is determined by local assessors to be the total taxable value of land and additions on the property. | Land | Improvement |
|---|---|---|---|---|
| 2025 | $2,393 | $64,640 | $15,770 | $48,870 |
| 2024 | $2,314 | $54,720 | $12,240 | $42,480 |
| 2023 | $2,314 | $54,720 | $12,240 | $42,480 |
| 2022 | $2,323 | $54,720 | $12,240 | $42,480 |
| 2021 | $2,246 | $44,850 | $10,030 | $34,820 |
| 2020 | $2,248 | $44,850 | $10,030 | $34,820 |
| 2019 | $2,291 | $44,850 | $10,030 | $34,820 |
| 2018 | $2,067 | $38,840 | $9,290 | $29,550 |
| 2017 | $1,771 | $38,837 | $9,286 | $29,551 |
| 2016 | $1,751 | $38,662 | $9,286 | $29,376 |
| 2015 | $1,692 | $35,977 | $9,286 | $26,691 |
| 2014 | $1,692 | $35,977 | $9,286 | $26,691 |
| 2013 | $1,652 | $35,977 | $9,286 | $26,691 |
Source: Public Records
Map
Nearby Homes
- 5060 Morris Rd
- 4273 Kay Ave
- 4607 Plateau Dr S
- 4293 Yale St
- 1977 Willoughby Ave
- 1836 Dunseth Ln
- 1812 Willow Lakes Dr
- 4954 E County Line Rd
- 4500 Bosart Rd
- 4890 Brannan Dr W Unit 4890
- 1470 Oldham Dr Unit 12
- 5564 Ridgewood Rd E Unit 7
- 1398 Elizabeth Ct Unit 66
- 1495 Victorian Way
- 1521 Erika Dr
- 5033 Ridgewood Rd E
- 5564 Ridgewood Rd W
- 4652 Reno Ln Unit 15
- 4577 Reno Ln Unit 2
- 9 Middle Urbana Rd
Your Personal Tour Guide
Ask me questions while you tour the home.