Estimated Value: $346,000 - $351,000
3
Beds
1
Bath
1,756
Sq Ft
$199/Sq Ft
Est. Value
About This Home
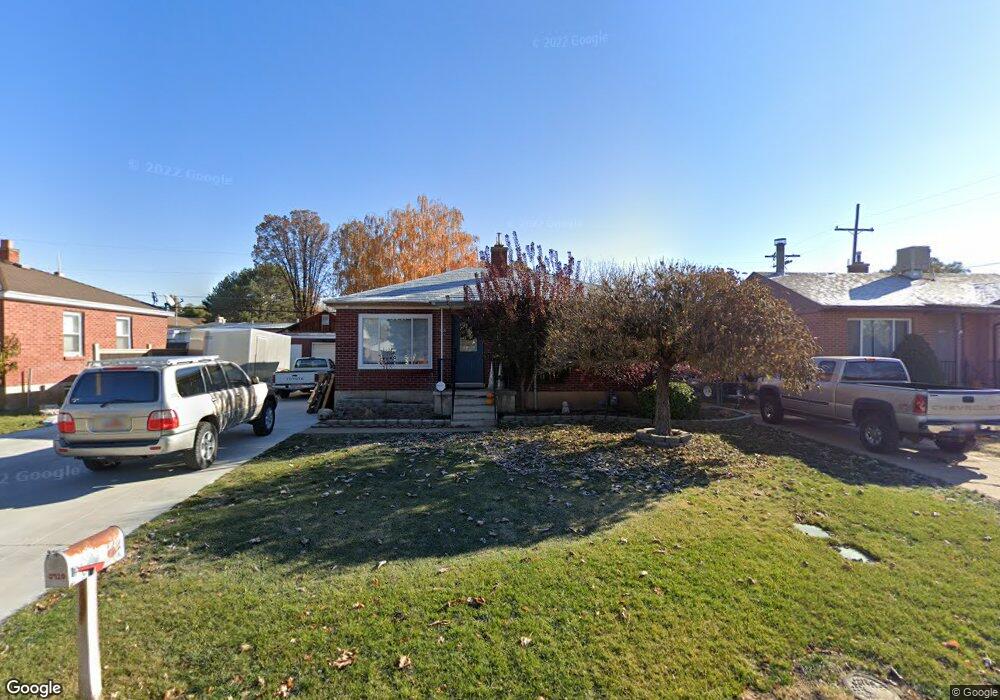
This home is located at 5920 S 2600 W, Roy, UT 84067 and is currently estimated at $349,094, approximately $198 per square foot. 5920 S 2600 W is a home located in Weber County with nearby schools including Roy Elementary School, Roy Junior High School, and Roy High School.
Ownership History
Date
Name
Owned For
Owner Type
Purchase Details
Closed on
Mar 15, 2018
Sold by
Ohlin Jared W and Ohlin Lindsey H
Bought by
Ohlin Jared and Ohlin Lindsey
Current Estimated Value
Home Financials for this Owner
Home Financials are based on the most recent Mortgage that was taken out on this home.
Original Mortgage
$117,270
Outstanding Balance
$67,821
Interest Rate
4.22%
Mortgage Type
New Conventional
Estimated Equity
$281,273
Purchase Details
Closed on
Jun 29, 2005
Sold by
Woodland Elnora M
Bought by
Ohlin Jared W and Ohlin Lindsey H
Purchase Details
Closed on
Nov 14, 2000
Sold by
Woodland Elnora M and Arave Linda J
Bought by
Woodland Elnora M
Home Financials for this Owner
Home Financials are based on the most recent Mortgage that was taken out on this home.
Original Mortgage
$88,000
Interest Rate
10.25%
Purchase Details
Closed on
Aug 13, 1997
Sold by
Woodland Elnora M
Bought by
Woodland Elnora M and Arave Linda J
Create a Home Valuation Report for This Property
The Home Valuation Report is an in-depth analysis detailing your home's value as well as a comparison with similar homes in the area
Home Values in the Area
Average Home Value in this Area
Purchase History
| Date | Buyer | Sale Price | Title Company |
|---|---|---|---|
| Ohlin Jared | -- | Eagle Gate Title Ins Ag | |
| Ohlin Jared W | -- | First American Title | |
| Woodland Elnora M | -- | Backman Stewart Title | |
| Woodland Elnora M | -- | Associated Title |
Source: Public Records
Mortgage History
| Date | Status | Borrower | Loan Amount |
|---|---|---|---|
| Open | Ohlin Jared | $117,270 | |
| Previous Owner | Woodland Elnora M | $88,000 |
Source: Public Records
Tax History Compared to Growth
Tax History
| Year | Tax Paid | Tax Assessment Tax Assessment Total Assessment is a certain percentage of the fair market value that is determined by local assessors to be the total taxable value of land and additions on the property. | Land | Improvement |
|---|---|---|---|---|
| 2025 | $2,095 | $322,797 | $99,993 | $222,804 |
| 2024 | $2,026 | $172,698 | $55,004 | $117,694 |
| 2023 | $1,897 | $161,150 | $54,998 | $106,152 |
| 2022 | $2,192 | $195,800 | $51,548 | $144,252 |
| 2021 | $1,677 | $242,999 | $60,476 | $182,523 |
| 2020 | $1,584 | $211,000 | $60,476 | $150,524 |
| 2019 | $1,491 | $186,000 | $36,403 | $149,597 |
| 2018 | $1,300 | $150,000 | $31,641 | $118,359 |
| 2017 | $1,172 | $125,000 | $31,641 | $93,359 |
| 2016 | $1,137 | $65,161 | $17,884 | $47,277 |
| 2015 | $1,062 | $62,051 | $20,512 | $41,539 |
| 2014 | $988 | $56,259 | $15,239 | $41,020 |
Source: Public Records
Map
Nearby Homes