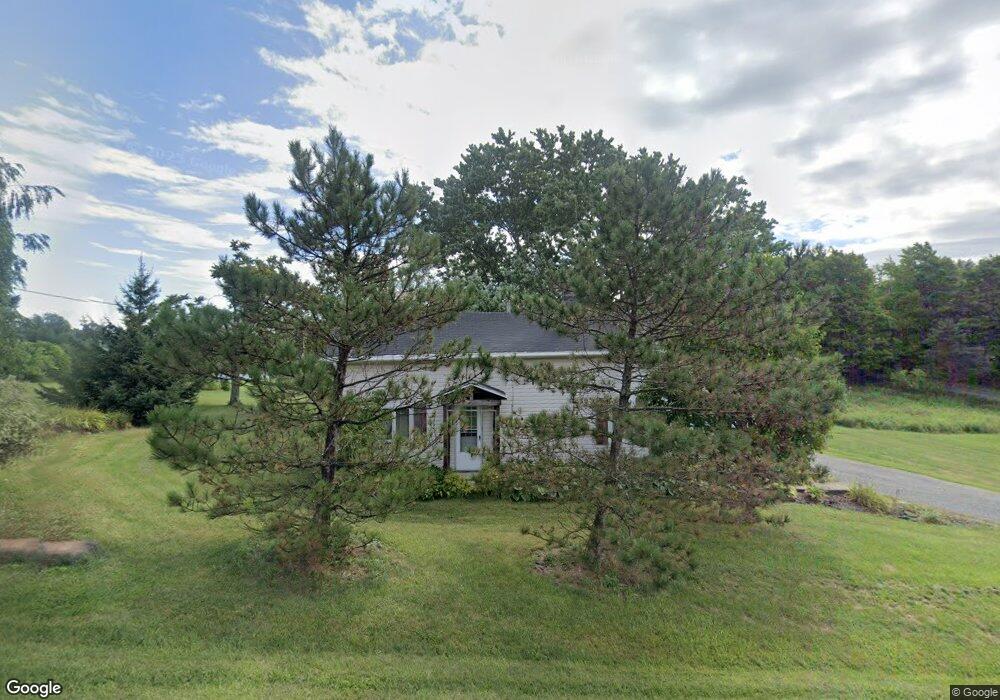
5920 Smith Rd Canandaigua, NY 14424
Estimated Value: $201,000 - $268,000
6
Beds
2
Baths
1,750
Sq Ft
$137/Sq Ft
Est. Value
About This Home
This home is located at 5920 Smith Rd, Canandaigua, NY 14424 and is currently estimated at $240,477, approximately $137 per square foot. 5920 Smith Rd is a home located in Ontario County with nearby schools including Canandaigua Primary-Elementary School, Canandaigua Middle School, and Canandaigua Academy.
Ownership History
Date
Name
Owned For
Owner Type
Purchase Details
Closed on
Dec 8, 2009
Sold by
Shean Karl
Bought by
Tyler Larry
Current Estimated Value
Home Financials for this Owner
Home Financials are based on the most recent Mortgage that was taken out on this home.
Original Mortgage
$90,780
Outstanding Balance
$58,855
Interest Rate
5.02%
Estimated Equity
$181,622
Purchase Details
Closed on
Feb 17, 2006
Sold by
Washington Mutual Bank
Bought by
Shean Karl
Home Financials for this Owner
Home Financials are based on the most recent Mortgage that was taken out on this home.
Original Mortgage
$37,000
Interest Rate
12%
Purchase Details
Closed on
Feb 15, 2006
Sold by
Secretary Of Veterans Affairs
Bought by
Washington Mutual Bank
Home Financials for this Owner
Home Financials are based on the most recent Mortgage that was taken out on this home.
Original Mortgage
$37,000
Interest Rate
12%
Purchase Details
Closed on
Aug 7, 1998
Sold by
Shaben Mark D and Shaben Kristine A
Bought by
Hope Terry L
Create a Home Valuation Report for This Property
The Home Valuation Report is an in-depth analysis detailing your home's value as well as a comparison with similar homes in the area
Home Values in the Area
Average Home Value in this Area
Purchase History
| Date | Buyer | Sale Price | Title Company |
|---|---|---|---|
| Tyler Larry | $87,000 | George Schell, Jr | |
| Shean Karl | $36,000 | Paul Fioravanti | |
| Washington Mutual Bank | -- | Paul Fioravanti | |
| Hope Terry L | $57,000 | -- |
Source: Public Records
Mortgage History
| Date | Status | Borrower | Loan Amount |
|---|---|---|---|
| Open | Tyler Larry | $90,780 | |
| Previous Owner | Shean Karl | $37,000 |
Source: Public Records
Tax History
| Year | Tax Paid | Tax Assessment Tax Assessment Total Assessment is a certain percentage of the fair market value that is determined by local assessors to be the total taxable value of land and additions on the property. | Land | Improvement |
|---|---|---|---|---|
| 2024 | $3,390 | $150,000 | $30,600 | $119,400 |
| 2023 | $3,445 | $150,000 | $30,600 | $119,400 |
| 2022 | $3,294 | $115,000 | $23,500 | $91,500 |
| 2021 | $3,206 | $115,000 | $23,500 | $91,500 |
| 2020 | $2,579 | $115,000 | $23,500 | $91,500 |
| 2019 | $0 | $115,000 | $23,500 | $91,500 |
| 2018 | $2,549 | $115,000 | $23,500 | $91,500 |
| 2017 | $0 | $90,000 | $23,800 | $66,200 |
| 2016 | $1,879 | $90,000 | $23,800 | $66,200 |
| 2015 | -- | $90,000 | $23,800 | $66,200 |
| 2014 | -- | $90,000 | $23,800 | $66,200 |
Source: Public Records
Map
Nearby Homes
- 4338 Wells Curtice Rd
- 4700 State Route 21
- 6126 Rossier Rd
- 4765 Seneca Point Rd
- 0 Cramer Rd
- 4508 New York 64
- 4551 State Route 64
- 6234 County Road 32
- 0 Cr-32 Rd Unit R1657877
- 5071 Foster Rd
- 5073 Foster Rd
- 4308 Lake Hill Dr
- 5194 Laura Ln
- 4331 Tichenor Point Dr
- 4140 County Road 16
- 5029 Wyffels Rd
- 4128 Onnalinda Dr
- 5088 E Lake Rd
- 5340 County Road 11 Unit B
- 5403 Seneca Hill Dr
- 5925 Smith Rd
- 5924 Smith Rd
- 5930 Smith Rd
- 5920 Knapp Rd
- 5910 Smith Rd
- 5900 Knapp Rd
- 5865 Knapp Rd
- 5928 Knapp Rd
- 5901 Knapp Rd
- 5930 Knapp Rd
- 5790 Bristol Cross Rd
- 4442 Bristol Cross Rd
- 4380 Bristol Cross Rd
- 5935 Knapp Rd
- 4431 Bristol Cross Rd
- 5824 Smith Rd
- 5835 Smith Rd
- 6080 Goodale Rd
- 5933 Goodale Rd
- 6000 Knapp Rd
Your Personal Tour Guide
Ask me questions while you tour the home.