Estimated Value: $401,000 - $419,000
4
Beds
2
Baths
1,967
Sq Ft
$210/Sq Ft
Est. Value
About This Home
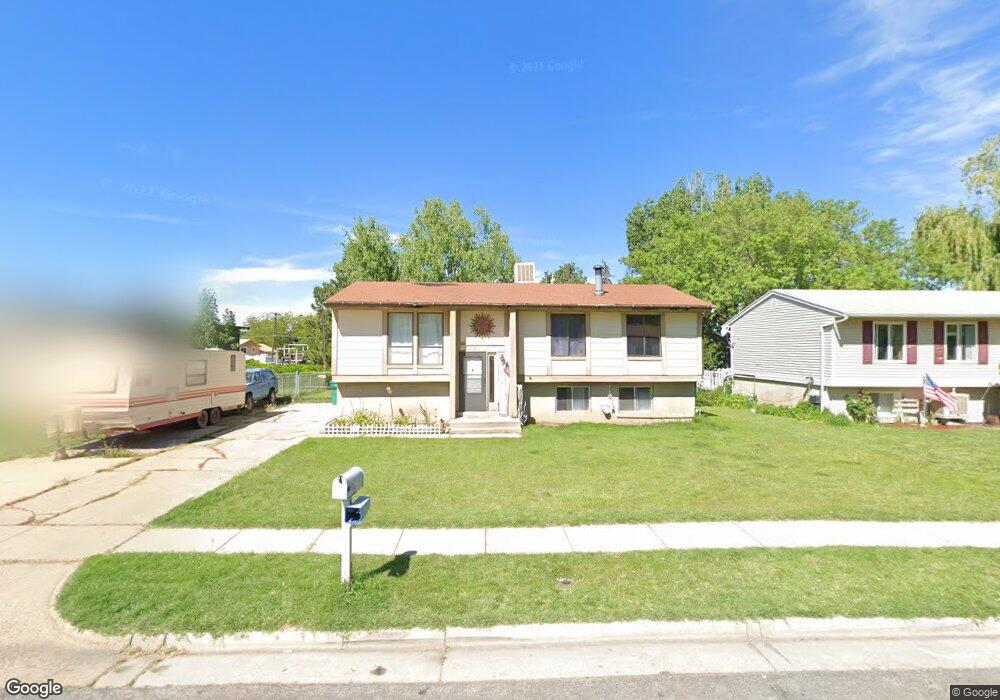
This home is located at 5921 S 2550 W, Roy, UT 84067 and is currently estimated at $412,349, approximately $209 per square foot. 5921 S 2550 W is a home located in Weber County with nearby schools including Roy Elementary School, Roy Junior High School, and Roy High School.
Ownership History
Date
Name
Owned For
Owner Type
Purchase Details
Closed on
Mar 18, 2024
Sold by
Peer Brett C and Peer Mary A
Bought by
Naylor-Caldwell Alexander
Current Estimated Value
Home Financials for this Owner
Home Financials are based on the most recent Mortgage that was taken out on this home.
Original Mortgage
$412,392
Outstanding Balance
$405,533
Interest Rate
6.63%
Mortgage Type
FHA
Estimated Equity
$6,816
Purchase Details
Closed on
Nov 2, 1998
Sold by
Mitchell Eric and Mitchell Ember
Bought by
Peer Brett C
Home Financials for this Owner
Home Financials are based on the most recent Mortgage that was taken out on this home.
Original Mortgage
$109,254
Interest Rate
6.6%
Mortgage Type
FHA
Create a Home Valuation Report for This Property
The Home Valuation Report is an in-depth analysis detailing your home's value as well as a comparison with similar homes in the area
Home Values in the Area
Average Home Value in this Area
Purchase History
| Date | Buyer | Sale Price | Title Company |
|---|---|---|---|
| Naylor-Caldwell Alexander | -- | First American Title | |
| Peer Brett C | -- | Bonneville Title Company | |
| Peer Brett C | -- | Bonneville Title Company |
Source: Public Records
Mortgage History
| Date | Status | Borrower | Loan Amount |
|---|---|---|---|
| Open | Naylor-Caldwell Alexander | $412,392 | |
| Previous Owner | Peer Brett C | $109,254 |
Source: Public Records
Tax History Compared to Growth
Tax History
| Year | Tax Paid | Tax Assessment Tax Assessment Total Assessment is a certain percentage of the fair market value that is determined by local assessors to be the total taxable value of land and additions on the property. | Land | Improvement |
|---|---|---|---|---|
| 2025 | $2,494 | $389,177 | $131,386 | $257,791 |
| 2024 | $2,415 | $208,449 | $72,273 | $136,176 |
| 2023 | $2,188 | $187,551 | $63,234 | $124,317 |
| 2022 | $2,416 | $215,600 | $62,082 | $153,518 |
| 2021 | $1,821 | $263,000 | $74,419 | $188,581 |
| 2020 | $1,717 | $228,000 | $74,419 | $153,581 |
| 2019 | $1,790 | $226,000 | $47,681 | $178,319 |
| 2018 | $1,619 | $191,000 | $42,523 | $148,477 |
| 2017 | $1,515 | $167,000 | $42,523 | $124,477 |
| 2016 | $1,431 | $84,634 | $22,034 | $62,600 |
| 2015 | $1,331 | $80,456 | $24,885 | $55,571 |
| 2014 | $1,257 | $74,550 | $19,130 | $55,420 |
Source: Public Records
Map
Nearby Homes