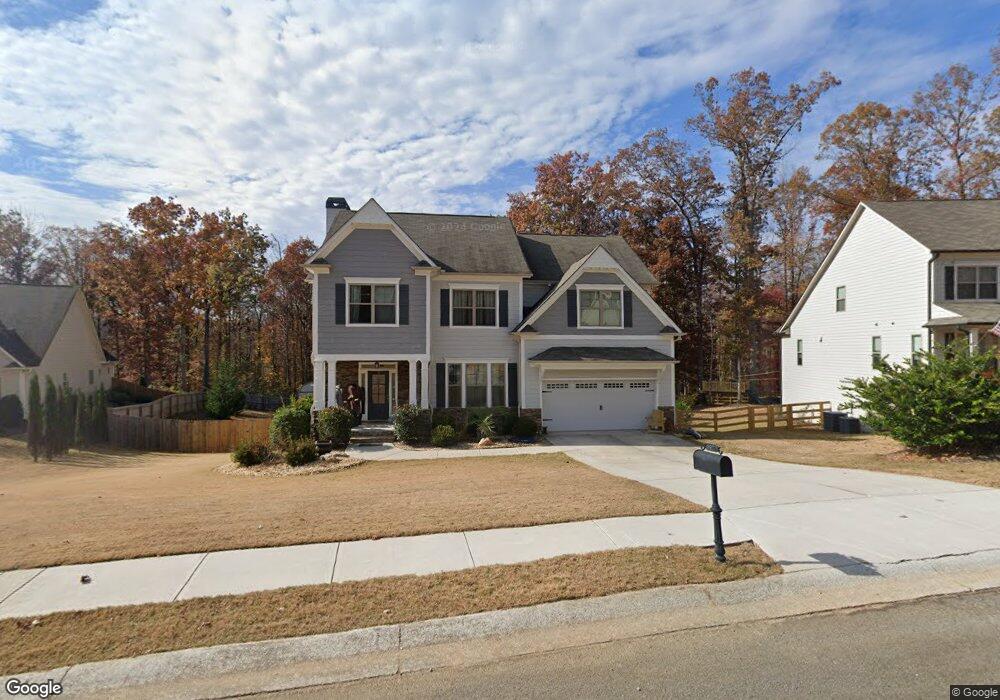
5922 Mountain Laurel Walk Flowery Branch, GA 30542
Estimated Value: $568,000 - $622,000
4
Beds
3
Baths
3,284
Sq Ft
$184/Sq Ft
Est. Value
About This Home
This home is located at 5922 Mountain Laurel Walk, Flowery Branch, GA 30542 and is currently estimated at $604,010, approximately $183 per square foot. 5922 Mountain Laurel Walk is a home with nearby schools including Chestnut Mountain Elementary School, Cherokee Bluff Middle School, and Cherokee Bluff High School.
Ownership History
Date
Name
Owned For
Owner Type
Purchase Details
Closed on
Dec 4, 2015
Sold by
Veritas Homes Inc
Bought by
Calvo Sara E and Calvo Christina M
Current Estimated Value
Home Financials for this Owner
Home Financials are based on the most recent Mortgage that was taken out on this home.
Original Mortgage
$283,053
Outstanding Balance
$227,099
Interest Rate
3.91%
Mortgage Type
New Conventional
Estimated Equity
$376,911
Purchase Details
Closed on
May 21, 2015
Sold by
Reo Funding Solutions Iii Llc
Bought by
Veritas Homes Inc
Purchase Details
Closed on
Apr 11, 2012
Sold by
Redus Atlanta Housing Llc
Bought by
Reo Funding Solutions Iii Llc
Purchase Details
Closed on
Dec 7, 2010
Sold by
Dozier Communities Llc
Bought by
Redus Atlanta Housing Llc
Purchase Details
Closed on
Mar 20, 2006
Sold by
Park At Chestnut Mountain The
Bought by
Dozier Communities Llc
Create a Home Valuation Report for This Property
The Home Valuation Report is an in-depth analysis detailing your home's value as well as a comparison with similar homes in the area
Home Values in the Area
Average Home Value in this Area
Purchase History
| Date | Buyer | Sale Price | Title Company |
|---|---|---|---|
| Calvo Sara E | $297,950 | -- | |
| Veritas Homes Inc | $126,500 | -- | |
| Reo Funding Solutions Iii Llc | $388,600 | -- | |
| Redus Atlanta Housing Llc | -- | -- | |
| Dozier Communities Llc | $4,462,500 | -- |
Source: Public Records
Mortgage History
| Date | Status | Borrower | Loan Amount |
|---|---|---|---|
| Open | Calvo Sara E | $283,053 |
Source: Public Records
Tax History Compared to Growth
Tax History
| Year | Tax Paid | Tax Assessment Tax Assessment Total Assessment is a certain percentage of the fair market value that is determined by local assessors to be the total taxable value of land and additions on the property. | Land | Improvement |
|---|---|---|---|---|
| 2024 | $2,067 | $219,840 | $34,200 | $185,640 |
| 2023 | $1,795 | $215,760 | $32,560 | $183,200 |
| 2022 | $1,741 | $180,280 | $40,360 | $139,920 |
| 2021 | $1,606 | $156,000 | $16,000 | $140,000 |
| 2020 | $1,579 | $149,720 | $16,000 | $133,720 |
| 2019 | $1,754 | $164,080 | $13,600 | $150,480 |
| 2018 | $1,614 | $145,760 | $12,000 | $133,760 |
| 2017 | $1,536 | $146,880 | $6,000 | $140,880 |
| 2016 | $1,161 | $134,240 | $6,000 | $128,240 |
| 2015 | $233 | $3,400 | $3,400 | $0 |
| 2014 | $233 | $4,800 | $4,800 | $0 |
Source: Public Records
Map
Nearby Homes
- 7301 Mulberry Trace Ln Unit LOT 175
- 7297 Mulberry Trace Ln
- 7313 Mulberry Trace Ln Unit LOT 172
- 7317 Mulberry Trace Ln
- 7301 Mulberry Trace Ln
- 7313 Mulberry Trace Ln
- 7285 Mulberry Trace Ln
- 7265 Mulberry Trace Ln Unit LOT 213
- 7265 Mulberry Trace Ln
- 7325 Mulberry Trace Ln
- 7277 Mulberry Trace Ln Unit LOT 210
- 7273 Mulberry Trace Ln
- 7317 Mulberry Trace Ln Unit LOT 171
- 7297 Mulberry Trace Ln Unit LOT 176
- 7257 Mulberry Trace Ln
- 7321 Mulberry Trace Ln
- 7325 Mulberry Trace Ln Unit LOT 169
- 7277 Mulberry Trace Ln
- 7285 Mulberry Trace Ln Unit LOT 179
- 7273 Mulberry Trace Ln Unit LOT 211
- 5926 Mountain Laurel Walk
- 5918 Mountain Laurel Walk
- 5930 Mountain Laurel Walk
- 5914 Mountain Laurel Walk
- 5919 Mountain Laurel Walk
- 5847 Mulberry Hollow
- 5934 Mountain Laurel Walk
- 5852 Mulberry Hollow
- 5843 Mulberry Hollow
- 7305 Mulberry Trace Ln
- 7269 Mulberry Trace Ln
- 7261 Mulberry Trace Ln
- 7309 Mulberry Trace Ln
- 7261 Mulberry Trace Ln Unit LOT 214
- 7269 Mulberry Trace Ln Unit LOT 212
- 7305 Mulberry Trace Ln Unit LOT 174
- 7309 Mulberry Trace Ln Unit LOT 173
- 5913 Mountain Laurel Walk
- 5882 Heritage Ridge
- 5878 Heritage Ridge