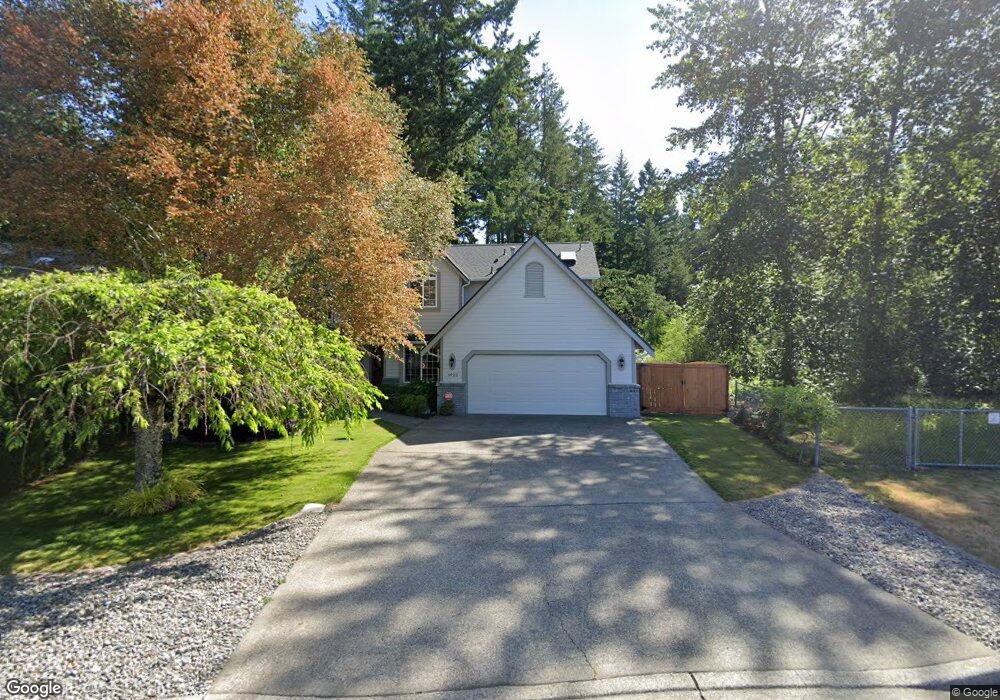
5923 Compton Loop SE Lacey, WA 98513
Lakepointe NeighborhoodEstimated Value: $500,000 - $549,000
3
Beds
3
Baths
1,945
Sq Ft
$266/Sq Ft
Est. Value
About This Home
This home is located at 5923 Compton Loop SE, Lacey, WA 98513 and is currently estimated at $518,307, approximately $266 per square foot. 5923 Compton Loop SE is a home located in Thurston County with nearby schools including Lakes Elementary School, Komachin Middle School, and Timberline High School.
Ownership History
Date
Name
Owned For
Owner Type
Purchase Details
Closed on
Mar 23, 2011
Sold by
Cannon Ashton
Bought by
Cannon Debbie
Current Estimated Value
Purchase Details
Closed on
Jun 26, 2003
Sold by
Kelley Paul T and Kelley Kathleen M
Bought by
Cannon Bennett and Cannon Debbie Anne
Home Financials for this Owner
Home Financials are based on the most recent Mortgage that was taken out on this home.
Original Mortgage
$196,350
Outstanding Balance
$81,261
Interest Rate
5.37%
Mortgage Type
VA
Estimated Equity
$437,046
Purchase Details
Closed on
Apr 13, 2000
Sold by
Lee Ralph and Lee Lynne M
Bought by
Kelley Paul T and Kelley Kathleen M
Home Financials for this Owner
Home Financials are based on the most recent Mortgage that was taken out on this home.
Original Mortgage
$175,821
Interest Rate
8.26%
Mortgage Type
VA
Purchase Details
Closed on
Apr 11, 1997
Sold by
Bergman William E and Bergman Martha J
Bought by
Lee Ralph and Lee Lynne M
Home Financials for this Owner
Home Financials are based on the most recent Mortgage that was taken out on this home.
Original Mortgage
$129,250
Interest Rate
7.12%
Create a Home Valuation Report for This Property
The Home Valuation Report is an in-depth analysis detailing your home's value as well as a comparison with similar homes in the area
Home Values in the Area
Average Home Value in this Area
Purchase History
| Date | Buyer | Sale Price | Title Company |
|---|---|---|---|
| Cannon Debbie | -- | None Available | |
| Cannon Bennett | $192,500 | Stewart Title Of Wester | |
| Kelley Paul T | $170,700 | Charter Title Corporation | |
| Lee Ralph | $161,600 | Transnation Title Insurance |
Source: Public Records
Mortgage History
| Date | Status | Borrower | Loan Amount |
|---|---|---|---|
| Open | Cannon Bennett | $196,350 | |
| Previous Owner | Kelley Paul T | $175,821 | |
| Previous Owner | Lee Ralph | $129,250 |
Source: Public Records
Tax History
| Year | Tax Paid | Tax Assessment Tax Assessment Total Assessment is a certain percentage of the fair market value that is determined by local assessors to be the total taxable value of land and additions on the property. | Land | Improvement |
|---|---|---|---|---|
| 2025 | $4,235 | $484,600 | $143,500 | $341,100 |
| 2024 | $4,235 | $470,000 | $137,700 | $332,300 |
| 2023 | $4,235 | $438,800 | $121,100 | $317,700 |
| 2022 | $4,185 | $448,700 | $82,700 | $366,000 |
| 2021 | $4,163 | $359,700 | $88,600 | $271,100 |
| 2020 | $3,745 | $333,300 | $87,300 | $246,000 |
| 2019 | $3,081 | $311,500 | $72,600 | $238,900 |
| 2018 | $3,406 | $253,700 | $57,100 | $196,600 |
| 2017 | $3,070 | $240,900 | $53,300 | $187,600 |
| 2016 | $2,852 | $223,000 | $50,100 | $172,900 |
| 2014 | -- | $218,200 | $50,100 | $168,100 |
Source: Public Records
Map
Nearby Homes
- 6733 Steamer Dr SE
- 5218 Pattison Lake Ln SE
- 6512 Steamer Dr SE
- 5117 Rumac St SE
- 5603 James St SE
- 6301 Stockton Ln SE Unit 6
- 6301 Stockton Ln SE Unit 2
- 6305 61st Ave SE
- 7349 Fair Oaks Rd SE
- 6317 Barstow Ln SE Unit 8
- 6946 47th Ln SE Unit 2B
- 7305 49th Ave SE
- 6246 Wade Ct SE
- 7604 Brianna Ct SE
- 6068 Illinois Ln SE Unit A
- 6026 57th Ave SE
- 6036 55th Ct SE
- 4605 Timberline Dr SE
- 7712 Brianna Ct SE
- 5933 55th Way SE
- 5921 Compton Loop SE
- 5919 Compton Loop SE
- 5917 Compton Loop SE
- 5934 Compton Loop SE
- 5910 Compton Loop SE
- 5915 Compton Loop SE
- 5928 Compton Loop SE
- 5904 Compton Loop SE
- 5913 Compton Loop SE
- 5902 Compton Loop SE
- 5909 Compton Loop SE
- 5907 Compton Loop SE
- 5905 Compton Loop SE
- 5645 Pattison Lake Dr SE
- 5903 Compton Loop SE
- 5901 Compton Loop SE
- 6835 57th Ct SE
- 5929 Danials Loop SE
- 6833 57th Ct SE
- 5927 Danials Loop SE
Your Personal Tour Guide
Ask me questions while you tour the home.