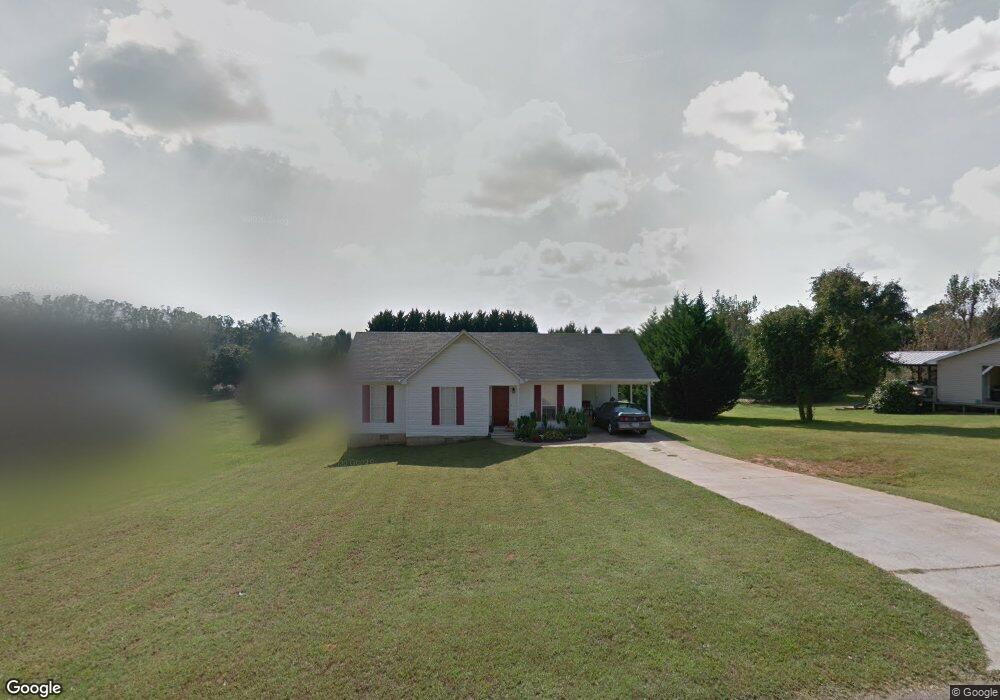
5924 Fieldstone Ct Clermont, GA 30527
Estimated Value: $262,092 - $308,000
3
Beds
2
Baths
1,074
Sq Ft
$262/Sq Ft
Est. Value
About This Home
This home is located at 5924 Fieldstone Ct, Clermont, GA 30527 and is currently estimated at $281,023, approximately $261 per square foot. 5924 Fieldstone Ct is a home located in Hall County with nearby schools including Wauka Mountain Elementary School, North Hall Middle School, and North Hall High School.
Ownership History
Date
Name
Owned For
Owner Type
Purchase Details
Closed on
Sep 17, 2025
Sold by
Clark Debra Elaine
Bought by
5924 Fieldstone Court Llc
Current Estimated Value
Purchase Details
Closed on
Jan 14, 2003
Sold by
Clark William Michael
Bought by
Clark Debra Elaine
Purchase Details
Closed on
Jun 30, 1999
Sold by
Graham Nancy K
Bought by
Clark William Michael and Clark Debra E
Purchase Details
Closed on
Sep 25, 1998
Sold by
Clark William M-Etal
Bought by
Clark William M-Etal
Home Financials for this Owner
Home Financials are based on the most recent Mortgage that was taken out on this home.
Original Mortgage
$70,000
Interest Rate
6.96%
Mortgage Type
New Conventional
Purchase Details
Closed on
Nov 15, 1996
Sold by
Graham Daniel D
Bought by
Graham Nancy K
Purchase Details
Closed on
Jun 9, 1994
Sold by
Clark Debra E and Clark William Michael
Bought by
Graham Nanct K and Graham Daniel D
Create a Home Valuation Report for This Property
The Home Valuation Report is an in-depth analysis detailing your home's value as well as a comparison with similar homes in the area
Home Values in the Area
Average Home Value in this Area
Purchase History
| Date | Buyer | Sale Price | Title Company |
|---|---|---|---|
| 5924 Fieldstone Court Llc | -- | -- | |
| Clark Debra Elaine | -- | -- | |
| Clark William Michael | $610,000 | -- | |
| Clark William M-Etal | -- | -- | |
| Graham Nancy K | -- | -- | |
| Graham Nanct K | -- | -- |
Source: Public Records
Mortgage History
| Date | Status | Borrower | Loan Amount |
|---|---|---|---|
| Previous Owner | Clark William M-Etal | $70,000 |
Source: Public Records
Tax History Compared to Growth
Tax History
| Year | Tax Paid | Tax Assessment Tax Assessment Total Assessment is a certain percentage of the fair market value that is determined by local assessors to be the total taxable value of land and additions on the property. | Land | Improvement |
|---|---|---|---|---|
| 2024 | $2,205 | $86,320 | $7,640 | $78,680 |
| 2023 | $2,204 | $86,280 | $7,640 | $78,640 |
| 2022 | $1,936 | $72,360 | $7,640 | $64,720 |
| 2021 | $1,732 | $63,200 | $7,640 | $55,560 |
| 2020 | $1,701 | $60,240 | $7,640 | $52,600 |
| 2019 | $1,449 | $50,440 | $7,640 | $42,800 |
| 2018 | $1,296 | $43,360 | $7,640 | $35,720 |
| 2017 | $1,084 | $36,240 | $7,640 | $28,600 |
| 2016 | $1,046 | $35,760 | $4,480 | $31,280 |
| 2015 | $895 | $29,933 | $3,680 | $26,253 |
| 2014 | $895 | $29,933 | $3,680 | $26,253 |
Source: Public Records
Map
Nearby Homes
- 5814 Gailey Dr
- 5519 Cleveland Hwy
- 6223 Hulsey Rd
- 6310 Green Mountain Ln
- 6217 Green Mountain Ln
- 6708 Clermont Hwy
- 5722 Crystal
- 239 Brown Dr
- 5375 Clarks Bridge Rd
- 5367 Clarks Bridge Rd
- 455 Long Mountain Ct
- 6632 Mountain Meadow Dr
- 6552 Shoal Creek Rd
- 6421 Holly Springs Rd
- 5231 Dahlonega Hwy
- 2856 Woodbriar Dr
- 5928 Fieldstone Ct
- 0 Fieldstone Ct Unit 7484710
- 0 Fieldstone Ct Unit 8501851
- 0 Fieldstone Ct Unit 8432773
- 0 Fieldstone Ct Unit 8414979
- 0 Fieldstone Ct
- 5914 Fieldstone Ct
- 5925 Fieldstone Ct
- 5932 Fieldstone Ct Unit 24
- 5932 Fieldstone Ct
- 5921 Fieldstone Ct
- 5929 Fieldstone Ct
- 0 Glenfield N Unit 3164415
- 0 Glenfield N Unit 3272100
- 0 Glenfield N Unit 7340287
- 0 Glenfield N Unit 7484710
- 5917 Fieldstone Ct
- 5933 Fieldstone Ct
- 5844 Fieldstone Ct
- 5936 Fieldstone Ct