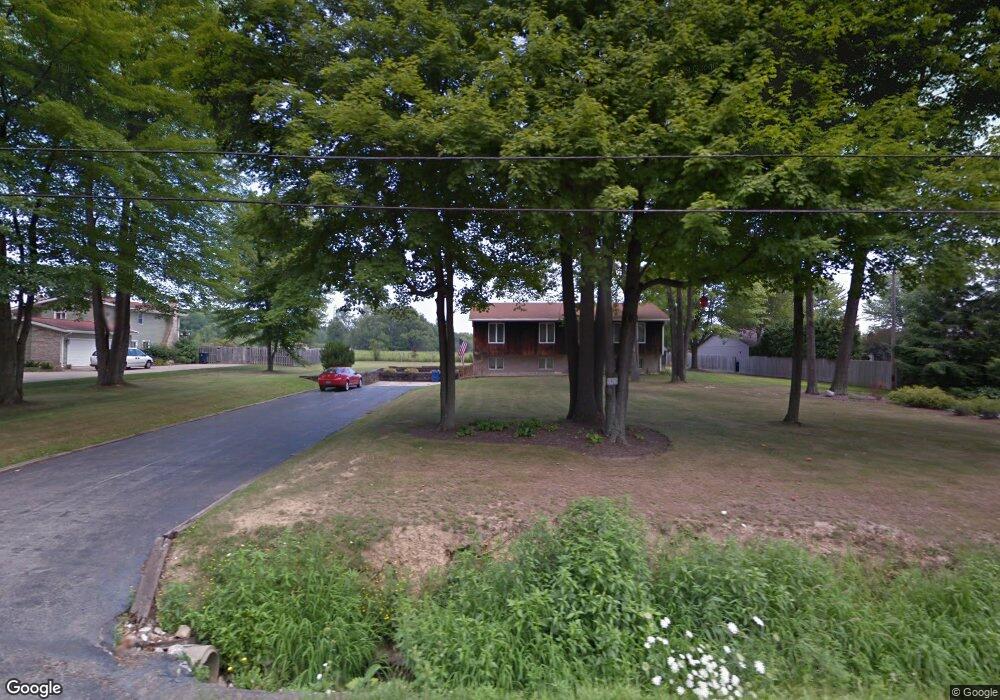
5925 Everett East Rd Hubbard, OH 44425
Estimated Value: $192,000 - $421,000
3
Beds
2
Baths
1,954
Sq Ft
$148/Sq Ft
Est. Value
About This Home
This home is located at 5925 Everett East Rd, Hubbard, OH 44425 and is currently estimated at $288,766, approximately $147 per square foot. 5925 Everett East Rd is a home located in Trumbull County with nearby schools including Brookfield Elementary School, Brookfield Middle School, and Brookfield High School.
Ownership History
Date
Name
Owned For
Owner Type
Purchase Details
Closed on
Nov 25, 2025
Sold by
Ashman Eric J and Ashman Sandra A
Bought by
Ashman Eric J
Current Estimated Value
Purchase Details
Closed on
Jul 26, 2011
Sold by
Ashman David F and Ashman Darlene P
Bought by
Ashman Eric J
Purchase Details
Closed on
Nov 28, 2009
Sold by
Ashman David F and Ashman Darlene P
Bought by
Ashman Eric J
Home Financials for this Owner
Home Financials are based on the most recent Mortgage that was taken out on this home.
Original Mortgage
$79,400
Interest Rate
5.11%
Mortgage Type
Seller Take Back
Purchase Details
Closed on
Feb 12, 2009
Sold by
Homesales Inc
Bought by
Ashman David F and Ashman Darlene P
Purchase Details
Closed on
Feb 3, 2009
Sold by
Shoup Allen J
Bought by
Homesales Inc
Purchase Details
Closed on
Jan 1, 1990
Bought by
Allen Shoup
Create a Home Valuation Report for This Property
The Home Valuation Report is an in-depth analysis detailing your home's value as well as a comparison with similar homes in the area
Home Values in the Area
Average Home Value in this Area
Purchase History
| Date | Buyer | Sale Price | Title Company |
|---|---|---|---|
| Ashman Eric J | -- | None Listed On Document | |
| Ashman Eric J | -- | None Available | |
| Ashman Eric J | $80,000 | Attorney | |
| Ashman David F | $54,900 | Attorney | |
| Homesales Inc | $56,000 | None Available | |
| Allen Shoup | -- | -- |
Source: Public Records
Mortgage History
| Date | Status | Borrower | Loan Amount |
|---|---|---|---|
| Previous Owner | Ashman Eric J | $79,400 |
Source: Public Records
Tax History
| Year | Tax Paid | Tax Assessment Tax Assessment Total Assessment is a certain percentage of the fair market value that is determined by local assessors to be the total taxable value of land and additions on the property. | Land | Improvement |
|---|---|---|---|---|
| 2024 | $2,942 | $64,260 | $5,530 | $58,730 |
| 2023 | $2,942 | $64,260 | $5,530 | $58,730 |
| 2022 | $2,755 | $48,790 | $5,110 | $43,680 |
| 2021 | $2,581 | $48,790 | $5,110 | $43,680 |
| 2020 | $2,564 | $48,790 | $5,110 | $43,680 |
| 2019 | $2,464 | $43,720 | $4,730 | $38,990 |
| 2018 | $2,442 | $43,720 | $4,730 | $38,990 |
| 2017 | $2,439 | $43,720 | $4,730 | $38,990 |
| 2016 | $2,252 | $38,820 | $4,730 | $34,090 |
| 2015 | $1,892 | $32,560 | $4,730 | $27,830 |
| 2014 | $1,883 | $32,560 | $4,730 | $27,830 |
| 2013 | $1,969 | $34,660 | $4,730 | $29,930 |
Source: Public Records
Map
Nearby Homes
- 5910 Chestnut Ridge Rd
- 2829 Tibbetts Wick Rd
- 256 Warner Rd
- 0 Smith Stewart Rd Unit 5120727
- 1255 Sodom Hutchings Rd SE
- 240 Warner Rd
- 5516 Benton Ln
- 0 Appaloosa Ln
- 5950 Mount Everett Rd
- 2479 Tibbetts Wick Rd
- 550 Warner Rd
- 0 Lakeview Dr Unit 5191346
- 0 Lakeview Dr Unit 5191352
- 0 Lakeview Dr Unit 5191342
- 0 Lakeview Dr Unit 5191347
- 0 Lakeview Dr Unit 5191335
- 0 Lakeview Dr Unit 5191338
- 0 Lakeview Dr Unit 5191326
- 0 Lakeview Dr Unit 5191349
- 7058 Pine Grove Dr
- 5913 Everett Rd E
- 5913 Everett East Rd
- 5941 Everett East Rd
- 0 Everett Rd E Unit 949701245
- 0 Everett Rd E Unit 4422332
- 0 Everett Rd E Unit 4358900
- 0 Everett Rd E Unit 4318082
- 0 Everett Rd E
- 5930 Everett Rd E
- 5961 Everett East Rd
- 5966 Everett Rd E
- 5966 Everett East Rd
- 1812 Albright McKay Rd SE
- 5840 Everett East Rd
- 6040 Everett East Rd
- 5791 Everett East Rd
- 6080 Everett East Rd
- 1534 Lake Dr
- 5759 Everett East Rd
- 5759 Everett Rd E
Your Personal Tour Guide
Ask me questions while you tour the home.