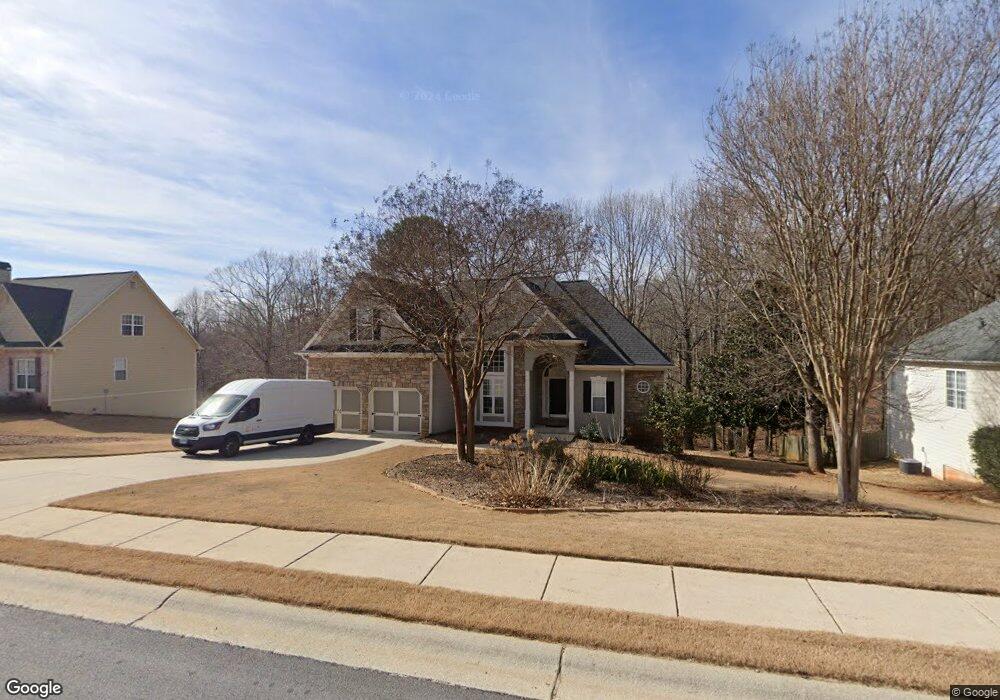
5925 Windsorcreek Dr Unit 1 Douglasville, GA 30135
Estimated Value: $307,078 - $379,000
3
Beds
2
Baths
1,875
Sq Ft
$187/Sq Ft
Est. Value
About This Home
This home is located at 5925 Windsorcreek Dr Unit 1, Douglasville, GA 30135 and is currently estimated at $350,520, approximately $186 per square foot. 5925 Windsorcreek Dr Unit 1 is a home located in Douglas County with nearby schools including South Douglas Elementary School, Fairplay Middle School, and Alexander High School.
Ownership History
Date
Name
Owned For
Owner Type
Purchase Details
Closed on
Apr 20, 2023
Sold by
Hudson Kevin
Bought by
Hudson Kevin Woodrow and Hudson Gaye Dubberly
Current Estimated Value
Purchase Details
Closed on
Oct 1, 2018
Sold by
Wiley Robert
Bought by
Hudson Kevin and Hudson Gaye
Purchase Details
Closed on
Apr 8, 2005
Sold by
Wallace Jamie D
Bought by
Wiley Robert E and Wiley Barbara
Home Financials for this Owner
Home Financials are based on the most recent Mortgage that was taken out on this home.
Original Mortgage
$167,200
Interest Rate
5.66%
Mortgage Type
New Conventional
Purchase Details
Closed on
Jul 10, 2003
Sold by
Ranco Construction Co
Bought by
Wallace Jamie D
Home Financials for this Owner
Home Financials are based on the most recent Mortgage that was taken out on this home.
Original Mortgage
$169,550
Interest Rate
5.29%
Mortgage Type
New Conventional
Create a Home Valuation Report for This Property
The Home Valuation Report is an in-depth analysis detailing your home's value as well as a comparison with similar homes in the area
Home Values in the Area
Average Home Value in this Area
Purchase History
| Date | Buyer | Sale Price | Title Company |
|---|---|---|---|
| Hudson Kevin Woodrow | -- | None Listed On Document | |
| Hudson Kevin | $210,000 | -- | |
| Wiley Robert E | $209,000 | -- | |
| Wallace Jamie D | $189,600 | -- |
Source: Public Records
Mortgage History
| Date | Status | Borrower | Loan Amount |
|---|---|---|---|
| Previous Owner | Wiley Robert E | $167,200 | |
| Previous Owner | Wallace Jamie D | $169,550 |
Source: Public Records
Tax History Compared to Growth
Tax History
| Year | Tax Paid | Tax Assessment Tax Assessment Total Assessment is a certain percentage of the fair market value that is determined by local assessors to be the total taxable value of land and additions on the property. | Land | Improvement |
|---|---|---|---|---|
| 2024 | $3,378 | $124,600 | $26,400 | $98,200 |
| 2023 | $3,378 | $144,560 | $27,520 | $117,040 |
| 2022 | $3,189 | $109,520 | $16,000 | $93,520 |
| 2021 | $2,711 | $85,400 | $13,800 | $71,600 |
| 2020 | $2,748 | $85,400 | $13,800 | $71,600 |
| 2019 | $747 | $83,400 | $13,800 | $69,600 |
| 2018 | $747 | $80,520 | $13,800 | $66,720 |
| 2017 | $806 | $77,120 | $14,680 | $62,440 |
| 2016 | $841 | $77,880 | $15,240 | $62,640 |
| 2015 | $804 | $69,320 | $13,960 | $55,360 |
| 2014 | $756 | $63,560 | $13,960 | $49,600 |
| 2013 | -- | $59,440 | $13,080 | $46,360 |
Source: Public Records
Map
Nearby Homes
- 6086 Willowpond Ct
- 5995 Azalea Ridge Dr
- 8390 Mossybrook Ln
- 6035 Post Rd
- 8951 Callaway Dr
- 6554 Fox Run
- 5475 Trout Creek Dr
- 5419 Tyree Rd
- 6340 Lakeview Terrace
- 7935 Sweetwater Dr
- 7900 Sweetwater Dr
- 7900 Downs Rd
- 5270 Pinnacle Pointe
- 5522 Tyree Rd
- 8228 River Pointe Overlook
- 5512 Tyree Rd
- 7493 Elderberry Dr
- 5845 Pecan Grove Place
- 5935 Windsorcreek Dr Unit 1
- 5915 Windsor Creek Dr
- 5905 Windsorcreek Dr Unit 1
- 5920 Windsorcreek Dr Unit 1
- 5940 Windsor Creek Dr
- 0 Windsor Creek Dr Unit 8910919
- 0 Windsor Creek Dr Unit 8910890
- 0 Windsor Creek Dr Unit 8941865
- 0 Windsor Creek Dr Unit 3064439
- 0 Windsor Creek Dr Unit 3096154
- 0 Windsor Creek Dr Unit 3191127
- 0 Windsor Creek Dr Unit 7507539
- 0 Windsor Creek Dr Unit 7639229
- 0 Windsor Creek Dr Unit 8020214
- 0 Windsor Creek Dr Unit 8239474
- 0 Windsor Creek Dr Unit 8246728
- 0 Windsor Creek Dr Unit 8247325
- 0 Windsor Creek Dr Unit 8269025
- 0 Windsor Creek Dr Unit 88
- 5910 Windsorcreek Dr Unit 1/2